
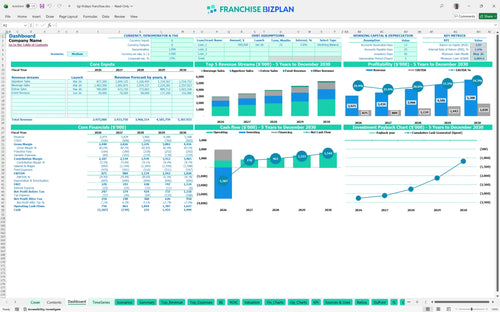
All-in-one Dashboard
Core inputs and core outputs


This restaurant business plan template provides a complete financial toolkit, including a capital expenditure budget, five-year P&L, and a detailed franchise investment calculator for prospective owners.
Core inputs and core outputs
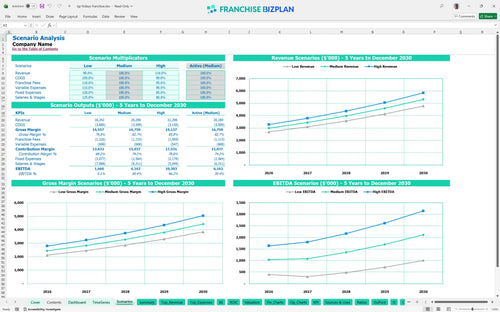
Three scenario analysis
Presentation ready
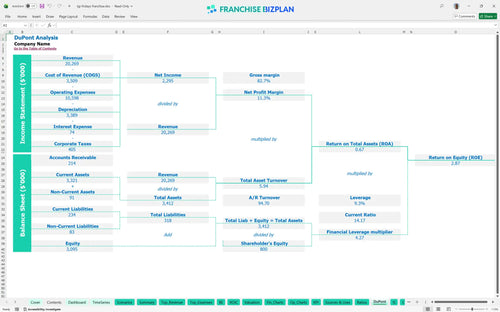
DuPont analysis
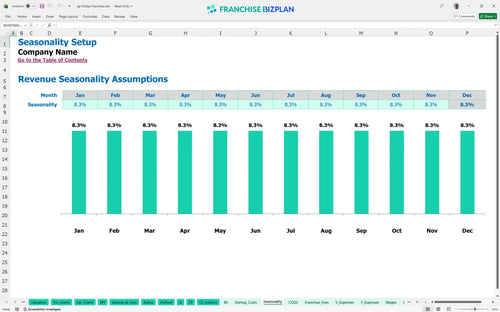
Researched revenue assumptions
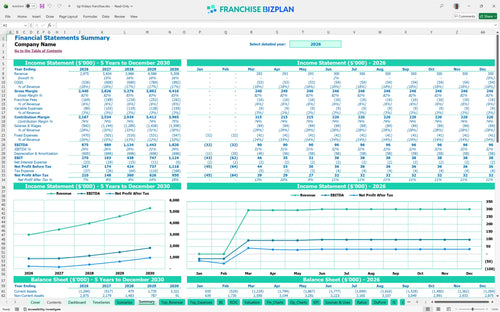
Lender-friendly financial outputs
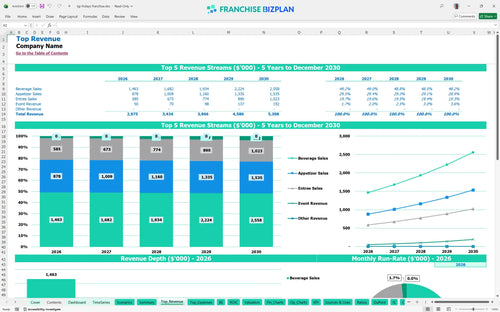
Revenue stream detailed view
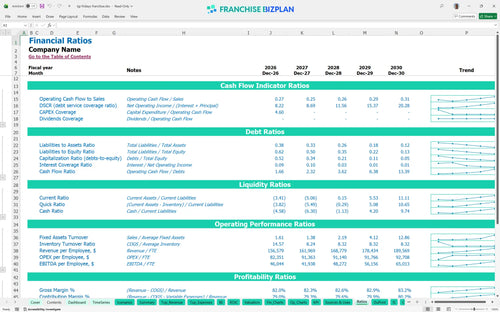
Performance metrics benchmark
We built this restaurant franchise financial model using detailed research on casual dining operations and unit economics. Key assumptions, including the $50,000 franchise fee, 4% royalty, and specific labor tiers for bartenders and line cooks, are pre-populated with researched data and are fully editable to help you conduct a financial feasibility study for new restaurant location.
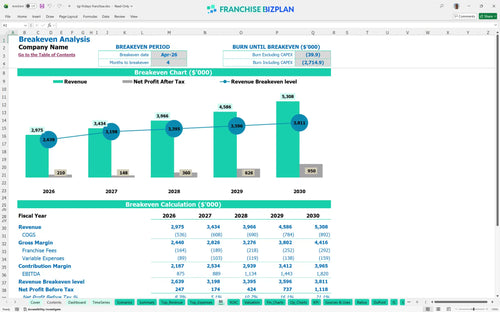
This unit is projected to reach operational profitability by April 2026, just four months after the initial launch. With year-one EBITDA estimated at $875,000, the model shows a steady climb in restaurant franchise unit economic performance metrics as revenue grows from $2.97M to $5.3M by year five. You will defintely need to manage the 13.5% food cost carefully to protect these margins.
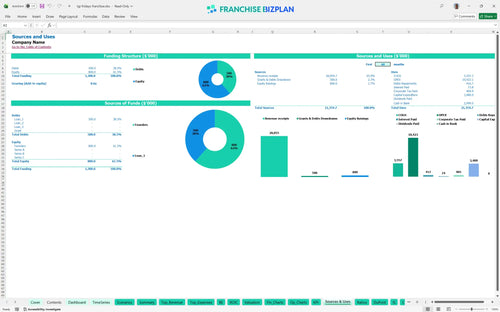
You will need $3.48 million in total capital to launch this unit, covering everything from the $50,000 franchise fee to the $1.2 million leasehold improvements. This startup cost breakdown ensures you account for the $650,000 kitchen package and $300,000 in AV systems required for the brand's immersive sports environment.
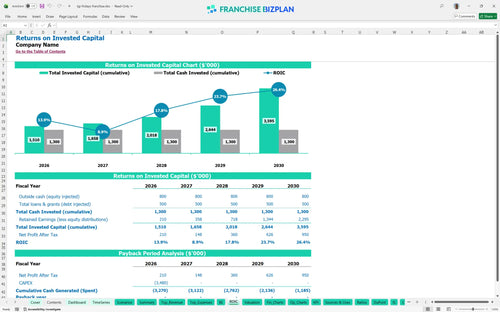
The restaurant ROI analysis shows an internal rate of return (IRR) of 1.56% and a return on equity of 2.87%. Because of the high initial CAPEX, the payback period occurs after year five, making this a long-term asset play. This model shows how to calculate ROI for a restaurant franchise by weighing year-five EBITDA of $1.82M against the initial $3.48M outlay.
The unit reaches its monthly break-even point in April 2026, driven primarily by the $1.56M combined annual sales of appetizers and beverages. Rent at $28,000 per month is the largest fixed burden, so maintaining high throughput during the lunch rush and happy hour is critical to covering these occupancy costs.
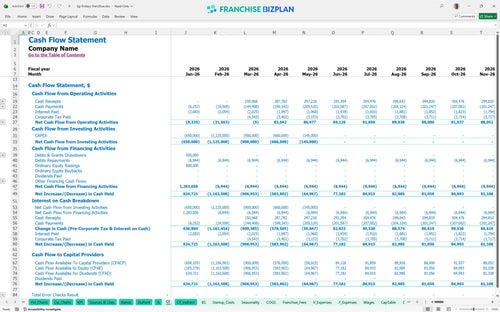
The lowest cash point hits -$2.085 million in May 2026, which reflects the timing gap between heavy construction spend and the initial revenue ramp. You should plan for a significant working capital buffer to handle the $336,000 annual rent and $130,000 general manager salary while estimating monthly operating costs for casual dining.
Using the franchise financial model for multi-unit operators, a 10% revenue drop in the 'Low' scenario significantly delays the payback period and increases the peak cash need. Conversely, hitting the 'High' case by maximizing event revenue and beverage sales can pull the ROI forward and boost year-one EBITDA well beyond the $875,000 baseline.
This restaurant franchise financial model is fully customizable in Excel, featuring pre-filled formulas and editable assumptions that allow you to adapt the projections to your specific urban territory and local market conditions. This Excel template for restaurant franchise business planning makes it easy to swap out rent, labor rates, and local taxes without breaking the logic.

Plan for long-term growth with detailed 5-year casual dining franchise financial projections that map out your path from grand opening to a mature, multi-unit operation. You will learn how to project revenue for a new restaurant franchise by analyzing year-over-year growth from $2.97 million in year one to over $5.3 million by year five.

The model accurately captures franchise-specific financial obligations, including the initial $50,000 fee and ongoing franchise operating expenses like the 4% royalty and 1.5% marketing fund. This transparency helps you understand the real unit economics after the franchisor takes their cut of the gross sales.

Estimate your total initial investment with a detailed startup cost breakdown that covers leasehold improvements, kitchen equipment, and pre-opening training. The model calculates the exact sales volume required to cover your fixed costs, including the $28,000 monthly rent for a prime metropolitan location.

This model incorporates industry-standard benchmarks for casual dining, helping you sanity-check your labor costs and gross margins against high-performing units. It serves as one of the best financial forecasting tools for restaurant owners to ensure their pro forma stays within realistic operational ranges.


Simply purchase and download the financial model template, then access it instantly using Microsoft Excel or Google Sheets. No installation or technical expertise required-just open and start working.

Enter your business-specific numbers, including revenue projections, costs, and investment details. The pre-built formulas will automatically calculate financial insights, saving you time and effort.

Leverage the investor-ready format to confidently showcase your financial projections to banks, franchise representatives, or investors. Impress stakeholders with clear, data-driven insights and professional reports.

Leverage the investor-ready format to confidently present your projections to banks, franchise representatives, or investors.