
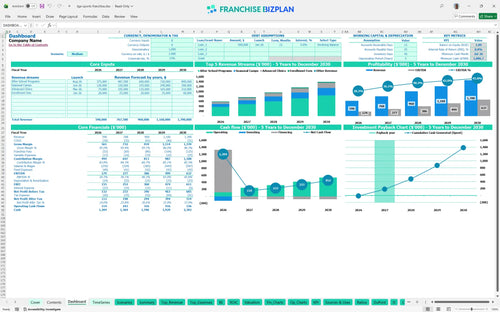
All-in-one Dashboard
Core inputs and core outputs


This franchise unit financial model template provides a comprehensive Excel-based tool for forecasting revenue, managing expenses, and analyzing the long-term profitability of a mobile sports business.
Core inputs and core outputs
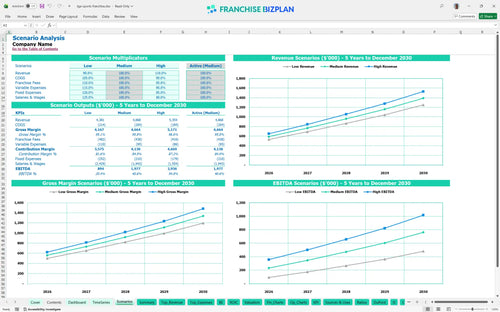
Three scenario analysis
Presentation ready
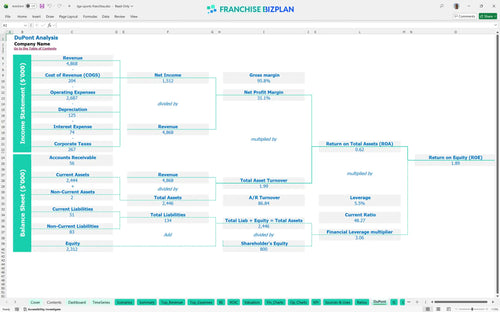
DuPont analysis
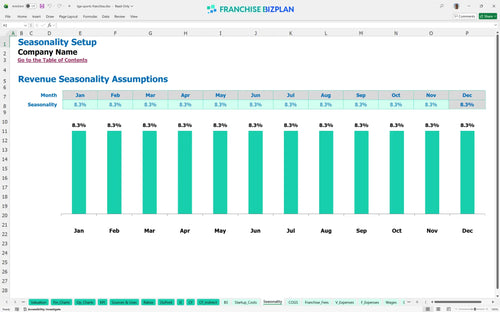
Researched revenue assumptions
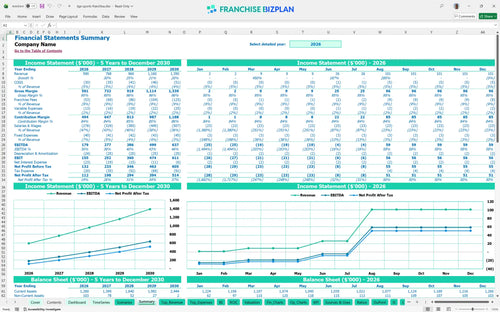
Lender-friendly financial outputs
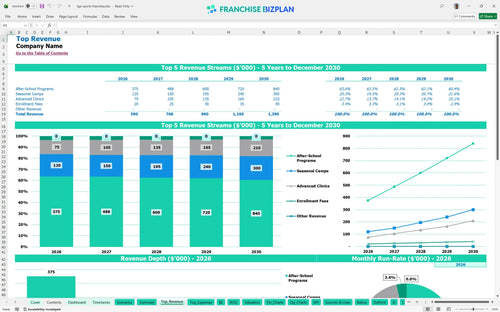
Revenue stream detailed view
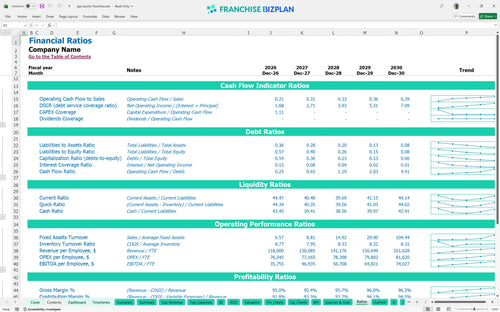
Performance metrics benchmark
We built this franchise unit financial model using detailed research into the mobile youth sports sector. Key assumptions, including the $49,500 franchise fee and projected year-one revenue of $590,000, are pre-populated and fully editable to match your specific market conditions.
The unit reaches profitability within the first year, generating an EBITDA of $179,000 by month 12. We calculate this by subtracting the 8% royalty, 1% marketing fee, and labor costs-like the $65,000 GM salary-from total revenue. Profitability is a marathon, not a sprint.
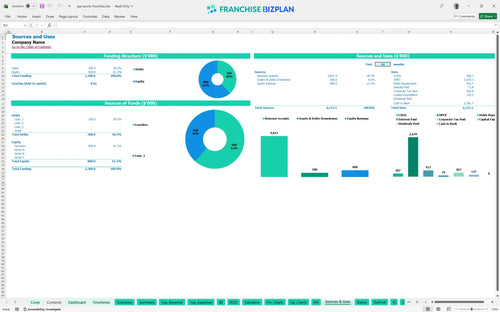
You need a total initial investment that covers the $49,500 franchise fee, $30,000 for equipment kits, and $20,000 for a transport vehicle. The model also accounts for $7,000 in launch marketing to drive early enrollment. Capital is the fuel for your franchise engine.
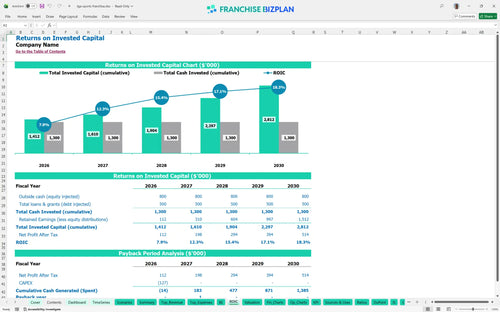
Investors can expect an Internal Rate of Return (IRR) of 8.8% and a Return on Equity (ROE) of 1.89. The payback period is remarkably fast at just 2 years, meaning you recover your initial outlay quickly. Time is the most expensive currency in franchising.
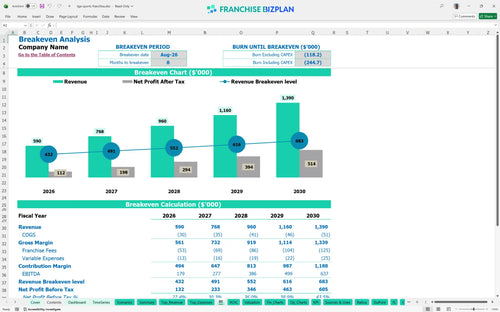
The unit hits its monthly break-even point in August 2026, roughly 8 months after launch. This timing is heavily dependent on the volume of after-school programs, which are projected to bring in $250,000 in the first year. Speed to break-even determines your survival.
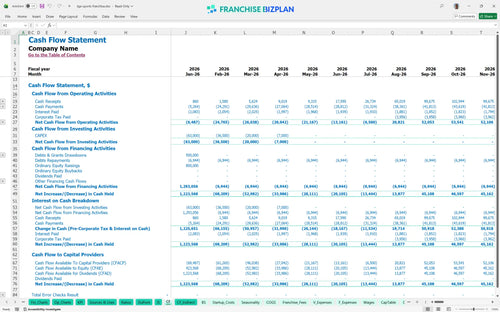
The lowest cash point occurs in July 2026, with a minimum cash requirement of $1,007,000. You need a solid runway to cover the pre-opening costs and the initial months of operation before revenue fully ramps up. Cash is oxygen for a new business.
Comparing Low, Medium, and High scenarios shows how sensitive the model is to enrollment numbers. A High scenario significantly boosts the 8.8% IRR by leveraging fixed costs like the $900 vehicle lease against higher revenue. Scenarios prepare you for the real world.
This franchise unit financial model is built in Excel, allowing you to adjust every assumption to fit your specific territory. You can defintely swap out the pre-filled data for your local labor rates, school district contracts, and facility fees without breaking the logic. It's the difference between a guess and a plan.

Mapping out five years is essential for understanding how a youth sports franchise scales from a single school to a full territory. The model shows revenue growing from $590,000 in year one to $1.39 million by year five as you add more programs and clinics. Growth is great, but cash flow is king.

Royalties and brand funds are the 'rent' you pay for the system, and they hit the top line immediately. This model bakes in the 8% royalty and 1% marketing fee to show you exactly how much cash stays in the unit after the $49,500 initial fee. You can't manage what you don't track.

Launching a mobile franchise requires specific capital for items like the $20,000 transport vehicle and $30,000 in sports equipment kits. This tool calculates the break-even point-estimated at month 8-so you know exactly when the unit stops burning cash. Knowing your floor is as important as knowing your ceiling.

We've integrated benchmarks for an after-school enrichment business to ensure your projections are grounded in reality. For instance, sports equipment supplies should trend toward 2.3% of revenue as you gain scale, while facility access fees stay around 1.4%. Benchmarks keep your ego in check.


Simply purchase and download the financial model template, then access it instantly using Microsoft Excel or Google Sheets. No installation or technical expertise required-just open and start working.

Enter your business-specific numbers, including revenue projections, costs, and investment details. The pre-built formulas will automatically calculate financial insights, saving you time and effort.

Leverage the investor-ready format to confidently showcase your financial projections to banks, franchise representatives, or investors. Impress stakeholders with clear, data-driven insights and professional reports.

Leverage the investor-ready format to confidently present your projections to banks, franchise representatives, or investors.