
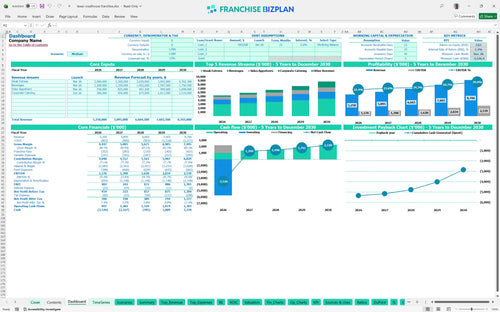
All-in-one Dashboard
Core inputs and core outputs


This comprehensive restaurant business plan Excel tool provides everything a franchisee needs to forecast revenue, manage capital expenditure planning, and optimize unit-level profitability over a five-year horizon.
Core inputs and core outputs
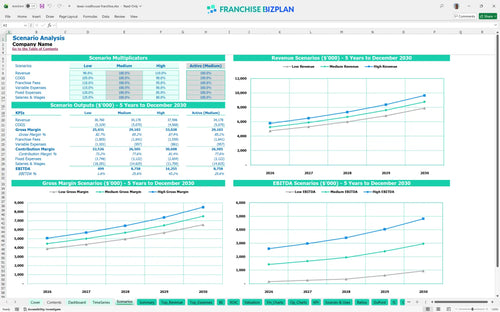
Three scenario analysis
Presentation ready
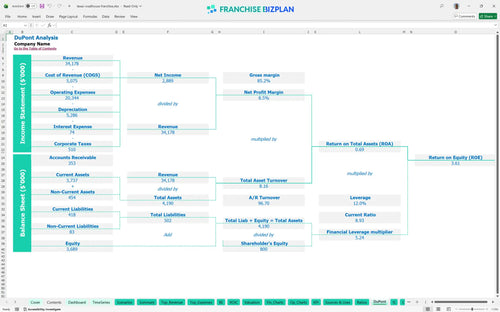
DuPont analysis
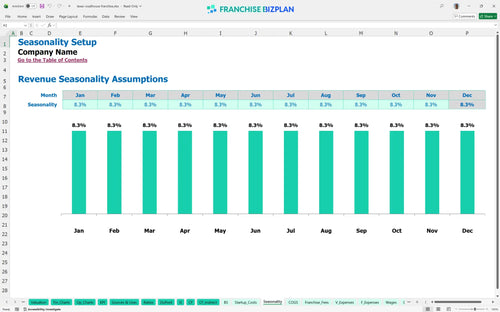
Researched revenue assumptions
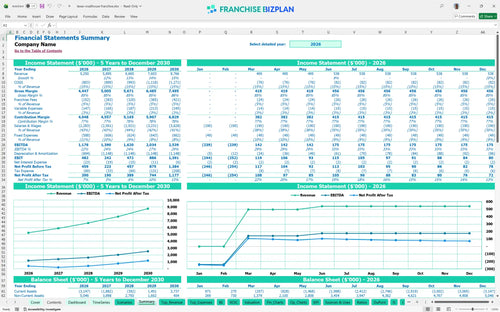
Lender-friendly financial outputs
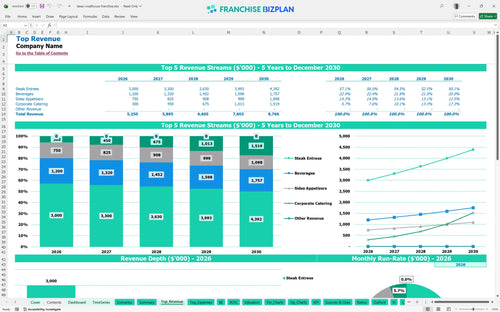
Revenue stream detailed view
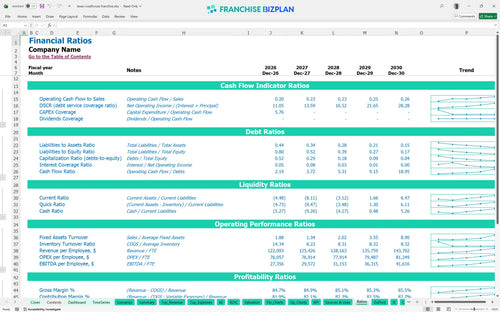
Performance metrics benchmark
We built this franchise unit financial model using deep research into high-volume casual dining economics. Key assumptions like the $40,000 franchise fee, 4% royalty, and specific staffing needs for line cooks and servers are pre-populated and fully editable. This model shows a year one EBITDA (earnings before interest, taxes, depreciation, and amortization) of $1.17 million, providing a realistic baseline for your investment.
This franchise unit becomes profitable almost immediately on an operating basis, achieving a positive EBITDA of $1.17 million in its first year. While the unit covers its operating expenses quickly, the high initial capital outlay means the total investment payback occurs after the five-year mark. We estimate a steady climb in net profit as revenue grows from $5.25 million to $8.76 million by year five.
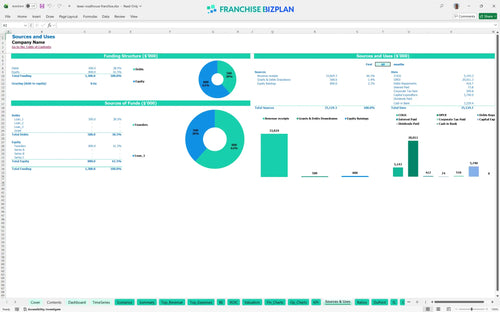
You will need approximately $5.74 million in total capital to launch this unit, primarily driven by significant leasehold improvements and high-end kitchen equipment. This franchise investment calculator accounts for the $40,000 initial fee and a $2.8 million build-out to meet brand standards. The sources of funds must cover these heavy upfront costs plus an opening cash buffer for the ramp-up period.
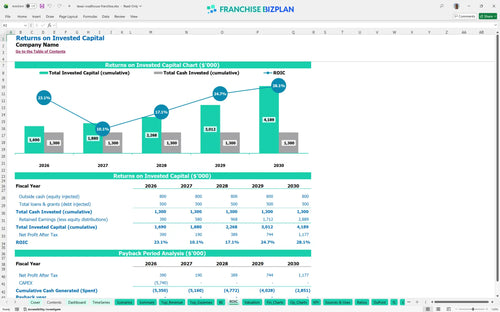
Investors can expect an Internal Rate of Return (IRR) of 1.21% and a Return on Equity (ROE) of 3.61% over the initial five-year period. While the cash flow is strong, the massive upfront investment of over $5.7 million results in a longer payback period extending beyond year five. Analyzing return on investment for new franchise units in this category requires focusing on long-term cash yield rather than a quick exit.
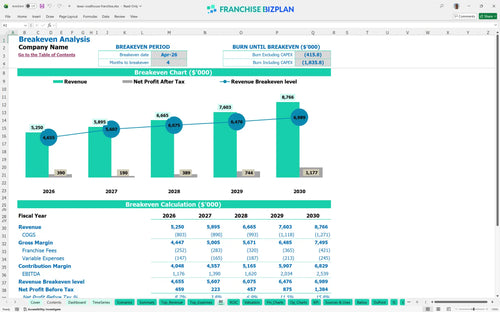
The unit reaches its monthly break-even point in April 2026, just four months after opening. This fast operational break-even is driven by high average tickets and a strong contribution margin from steak entrees and beverages. Managing the 13.5% food ingredient cost and the $28,000 monthly rent is critical to maintaining this trajectory.
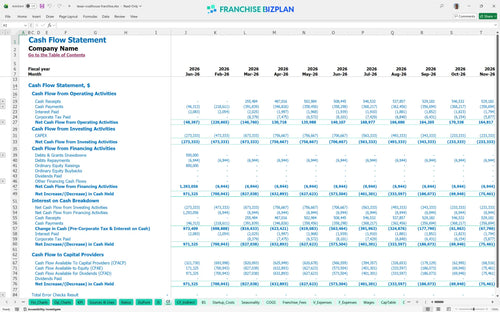
The lowest cash point occurs in December 2026, with a projected minimum cash requirement of $3.52 million. You will defintely need a robust capital reserve to handle the timing gap between the massive construction spend and the steady accumulation of operating cash. Maintaining a six-month runway of fixed expenses like rent and utilities is a best practice for restaurant franchise financial management.
A High scenario, driven by a 10% increase in traffic or average ticket, significantly accelerates the payback timeline and boosts year-one margins. Conversely, the Low scenario tests your ability to survive if corporate catering or steak sales underperform by 15%. This steps to create a franchise unit pro forma approach ensures you are prepared for volatility in food costs or labor markets.
This franchise financial model template is built in Excel to give you total control over your unit-level projections. You can adjust pre-filled formulas and editable assumptions to match your specific territory, whether you are looking at a single site or a multi-unit rollout. It simplifies the process of testing different operating scenarios without needing a degree in finance.

Planning for a high-volume restaurant requires a long-term view of cash flow and profitability beyond the first year. This restaurant franchise financial forecasting model for Excel provides a detailed 5-year outlook, mapping revenue growth from $5.25 million in year one to over $8.7 million by year five. It allows you to visualize how scaling restaurant operations with financial modeling impacts your bottom line as the unit matures.

The model accurately tracks your ongoing obligations to the franchisor, ensuring you understand the impact of top-line deductions. With royalty fee projections set at 4% and a marketing fund contribution of 0.8%, you can see exactly how much cash remains for local operations. This clarity is vital for maintaining brand standards while protecting your store-level margin.

Understanding how to calculate startup costs for a restaurant franchise is the first step toward a successful launch. This tool aggregates your total initial investment, including $2.8 million for leasehold improvements and $1.2 million for kitchen equipment, to determine your break-even analysis. It identifies the specific sales volume needed to cover both fixed costs, like the $28,000 monthly rent, and variable expenses.

We have integrated operational efficiency metrics to help you compare your unit's performance against casual dining standards. By using these benchmarks, you can sanity-check your food cost control strategies and labor allocations to ensure they remain competitive. This helps you spot margin leaks early and align your financial feasibility study for restaurant franchisees with real-world expectations.


Simply purchase and download the financial model template, then access it instantly using Microsoft Excel or Google Sheets. No installation or technical expertise required-just open and start working.

Enter your business-specific numbers, including revenue projections, costs, and investment details. The pre-built formulas will automatically calculate financial insights, saving you time and effort.

Leverage the investor-ready format to confidently showcase your financial projections to banks, franchise representatives, or investors. Impress stakeholders with clear, data-driven insights and professional reports.

Leverage the investor-ready format to confidently present your projections to banks, franchise representatives, or investors.