
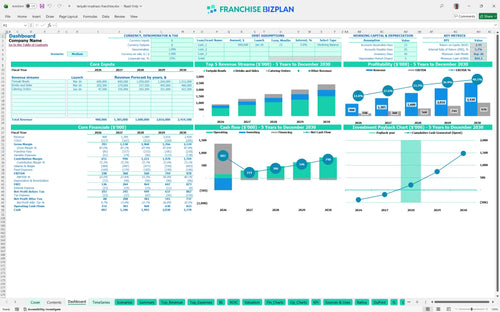
All-in-one Dashboard
Core inputs and core outputs


This pre-written excel model for franchise unit provides a complete financial toolkit including dynamic P&L statements, CAPEX schedules, and multi-scenario analysis for the modern operator.
Core inputs and core outputs
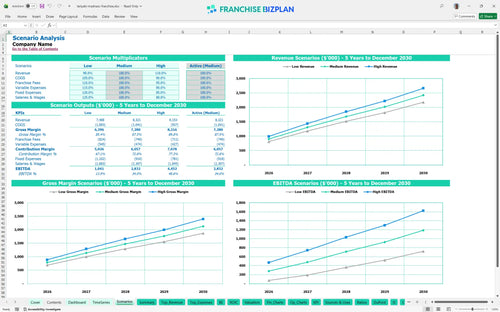
Three scenario analysis
Presentation ready
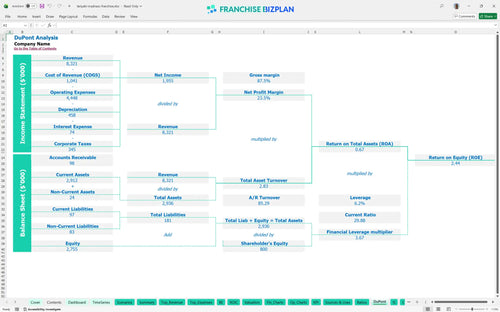
DuPont analysis
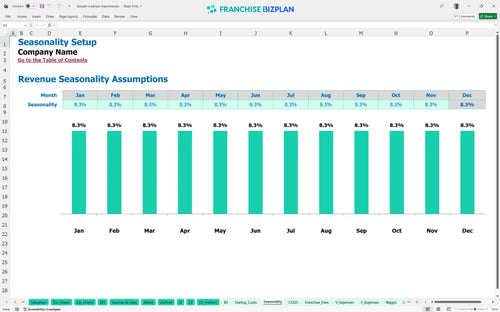
Researched revenue assumptions
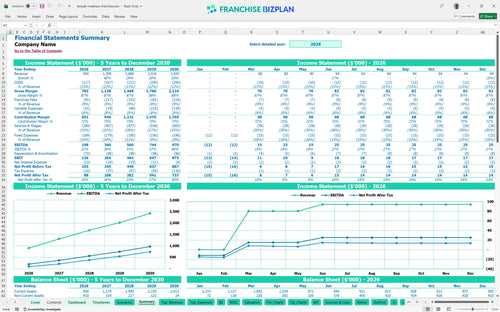
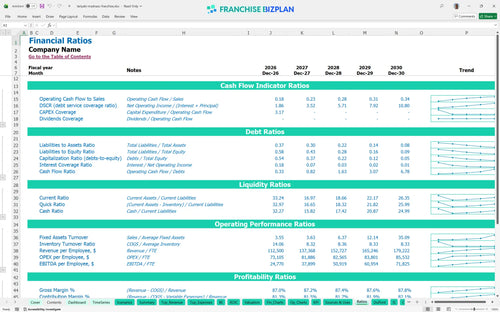
Lender-friendly financial outputs
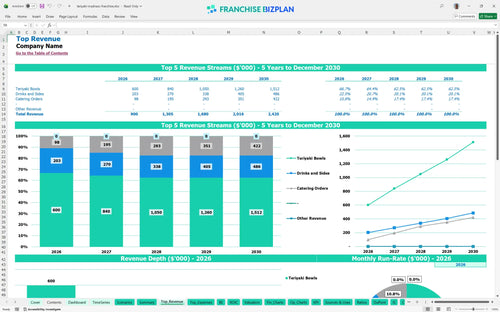
Revenue stream detailed view
Performance metrics benchmark
We built this franchise unit financial model using deep-dive research into the fast-casual sector. Key assumptions like the $900,000 year-one revenue and the 11.2% food cost are pre-populated but fully editable to fit your specific site. This tool helps you calculate startup costs for a fast-casual franchise and maps out everything from the $45,000 initial fee to the 3-year payback timeline.
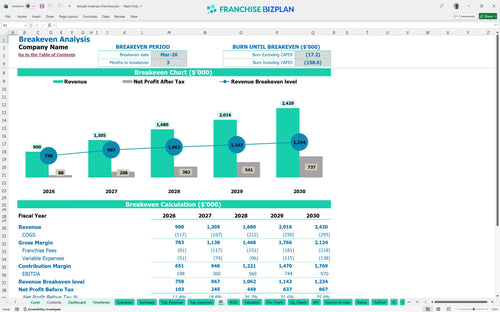
Based on the data, this unit hits its stride quickly, achieving breakeven by March 2026, just three months after launch. With year-one EBITDA projected at $198,000, the model shows a clear path to $970,000 in annual earnings by year five as catering and repeat app orders scale. Still, you need to manage the 3.5% delivery commissions to keep margins healthy.
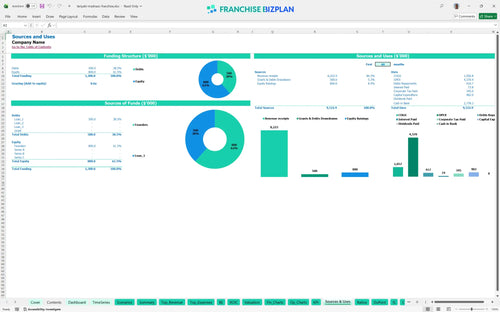
You'll need a significant war chest, with leasehold improvements and kitchen equipment totaling $300,000 alone. The total initial investment covers the $45,000 franchise fee, $25,000 for a grand opening splash, and $15,000 for initial inventory to ensure you don't run out of protein on day one. Here is the quick math: your total Capital expenditure (CapEx) is the primary hurdle before the first bowl is sold.
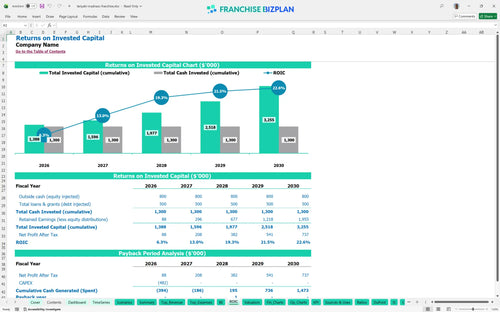
The model projects a 3-year payback period, which is standard for a high-performing fast-casual franchise. With an internal rate of return (IRR) of 5.72% and a return on equity of 2.44, the numbers suggest a stable, long-term play rather than a get-rich-quick scheme. Calculating ROI for a new franchise location is easier when you see the 5-year EBITDA climb from $198,000 to $970,000.
To cover your $10,000 rent and $1,800 utility bill, you need to hit breakeven within 3 months. The primary driver here is throughput-getting those $400,000 worth of bowls out the door in year one while managing the 2.2% payment processing bite. Honestly, the franchise operational costs are manageable if you hit the $900,000 year-one revenue target.
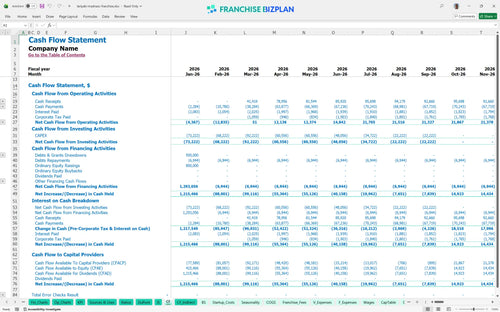
The lowest cash point hits in September 2026 at $842,000. This reflects the heavy CAPEX spend during the build-out phase and the initial ramp-up. You'll want to keep a close eye on the $25,000 exterior signage and $20,000 POS costs to ensure you don't dip deeper than planned. If opening takes 90+ days longer than planned, working capital pressure rises fast.
Moving from a medium to a high scenario can push year-five revenue toward that $2.42 million mark, significantly boosting your EBITDA margin. If sales underperform in the low case, the 9% combined royalty and marketing fee becomes a much heavier burden on your $198,000 year-one earnings. This franchise financial feasibility study template lets you stress-test these variables easily.
Finance: update unit break-even and payback model by Friday.
This franchise financial model lives in Excel, so you can swap out any number to fit your specific territory. We've pre-loaded it with formulas for bowls, sides, and catering, but you can defintely tweak the growth rates or pricing to match local competition. It's built to be a living document, not a static PDF, allowing you to adjust the restaurant franchise financial projection template as your site selection evolves.

Planning for a fast-casual franchise investment requires looking past the grand opening. This model tracks your trajectory from $900,000 in year one up to $2.42 million by year five, showing how EBITDA scales as you gain local density. It maps out the full P&L so you see exactly when the bottom line starts to swell and how to evaluate franchise investment profitability over a long horizon.

Royalties and marketing funds are the franchise tax that never goes away. We've baked in the 6% royalty and 3% marketing fee directly into the cash flow projections. This ensures your franchise profitability analysis accounts for every dollar sent back to the franchisor before you pay yourself or reinvest in the business. This is a critical part of any franchise unit profit and loss statement example.

Getting the doors open is the biggest hurdle in any restaurant startup costs plan. Between the $45,000 franchise fee and $200,000 in leasehold improvements, you need to know when the cash outflow stops. This model identifies the exact sales volume needed to cover your $10,000 monthly rent and high-volume labor, providing a clear break-even analysis for the first year.

I've included benchmarks for food ingredients, which start around 11.2% in this model, to help you sanity-check your numbers. If your packaging costs drift above the 1.8% target, you'll see the impact on store-level margin immediately. It's about keeping your fast-casual restaurant business plan excel grounded in reality and estimating operating expenses for food franchises accurately.


Simply purchase and download the financial model template, then access it instantly using Microsoft Excel or Google Sheets. No installation or technical expertise required-just open and start working.

Enter your business-specific numbers, including revenue projections, costs, and investment details. The pre-built formulas will automatically calculate financial insights, saving you time and effort.

Leverage the investor-ready format to confidently showcase your financial projections to banks, franchise representatives, or investors. Impress stakeholders with clear, data-driven insights and professional reports.

Leverage the investor-ready format to confidently present your projections to banks, franchise representatives, or investors.