
All-in-one Dashboard
Core inputs and core outputs


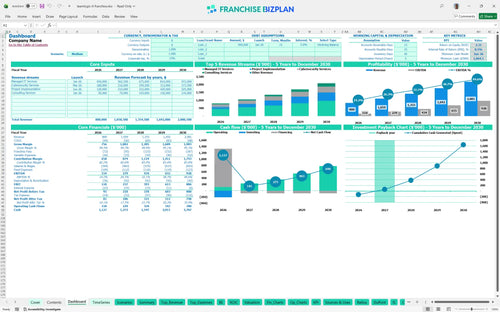
This financial spreadsheet for new franchise unit setup includes a dynamic dashboard for recurring revenue business planning and detailed expense tracking for technology-based operations.
Core inputs and core outputs
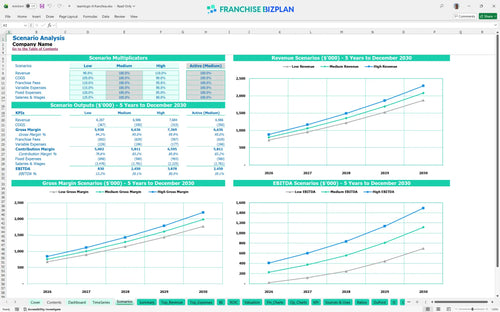
Three scenario analysis
Presentation ready
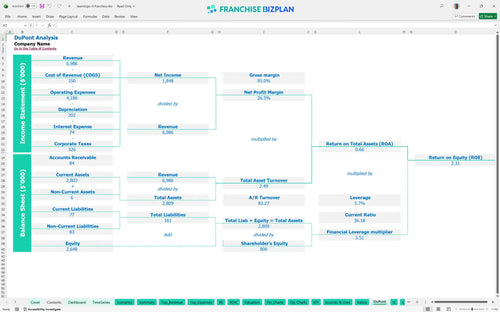
DuPont analysis
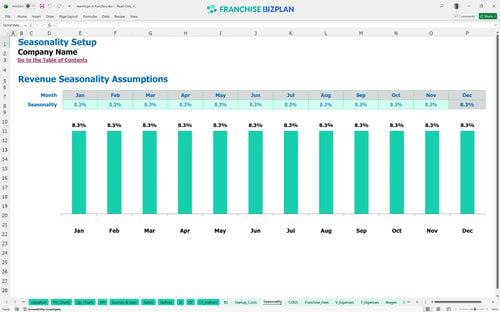
Researched revenue assumptions
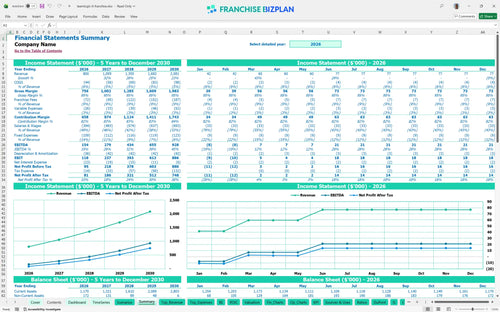
Lender-friendly financial outputs
Revenue stream detailed view
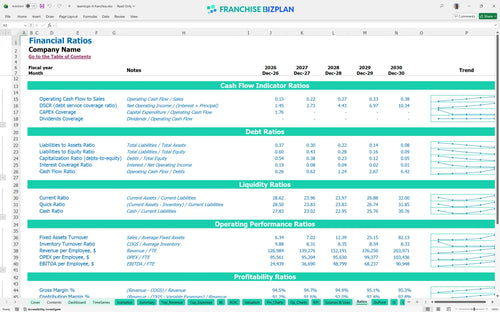
Performance metrics benchmark
We developed this franchise unit financial model through extensive research into the managed services sector and professional service franchise economics. The model comes pre-populated with data for four distinct revenue streams and detailed staffing plans, including field technicians and cybersecurity analysts. With a Year 1 EBITDA target of $154,000 and a clear path to $928,000 by Year 5, this tool provides a realistic roadmap for your investment.
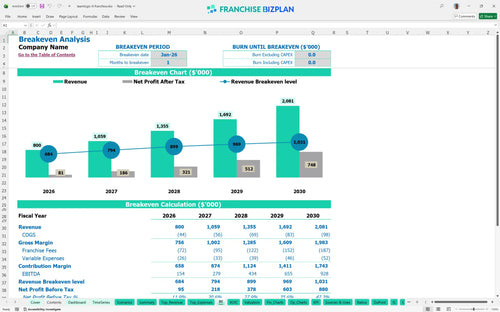
This unit reaches profitability almost immediately, with a break-even date in January 2026. By Year 1, you can expect an EBITDA of $154,000 after accounting for the 7% royalty and 2% marketing fees. The model shows net profit scaling significantly as recurring managed IT services reach $648,000 annually by the fifth year.
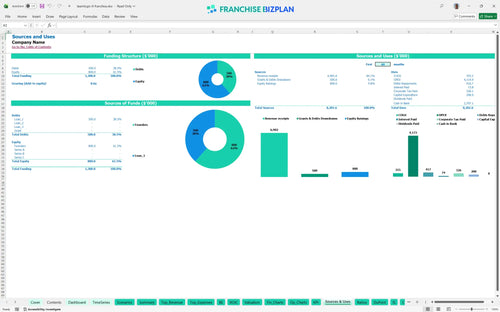
Launching this IT franchise in the US requires an initial investment covering the $49,500 franchise fee and approximately $158,500 in equipment and improvements. When you include the branded mobile units at $50,000 and office improvements of $45,000, your total startup capital must be carefully managed to maintain the required cash buffer during the ramp-up phase.
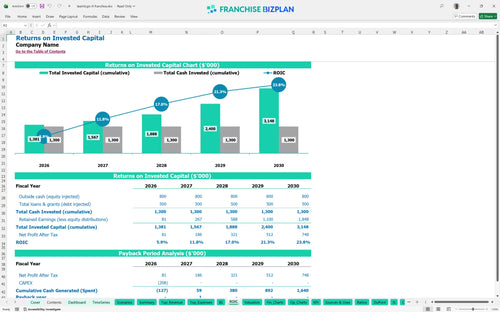
Investors can expect an Internal Rate of Return (IRR) of 8.5% and a Return on Equity (ROE) of 2.31. The model indicates a 2-year payback period, which is defintely strong for a professional services model. By Year 5, the unit generates $928,000 in EBITDA, representing a significant multiple on the initial startup investment.
The monthly break-even point is achieved in the first month of operations, January 2026. This rapid transition is driven by the high-margin nature of managed IT services and the relatively low fixed monthly rent of $6,000. Your ability to hit this target depends on securing initial B2B contracts and managing your $9,100 in total monthly fixed operating expenses.
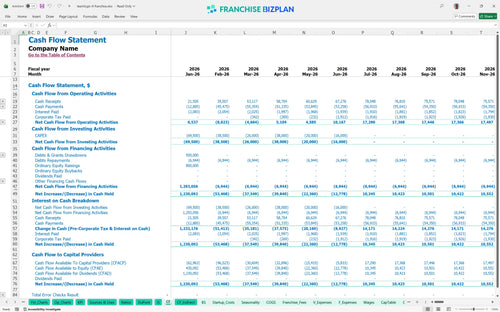
The lowest cash point occurs in June 2026, with a minimum cash balance of $1,064,000. This suggests the model assumes significant initial funding or financing to cover the early capital expenditures and technician salaries. You should maintain a six-month runway to handle the timing gap between project implementation and client payments.
The High scenario accelerates your path to the $2.08M revenue mark by Year 5 through better client retention and higher project volume. In contrast, a Low scenario with 15% lower revenue would tighten Year 1 margins, as fixed costs like the $70,000 Operations Manager salary and $6,000 rent remain constant. The scenario analysis helps you see how a 1-point shift in royalties or labor impacts your peak cash needs.
Finance: update unit break-even and payback model by Friday.
This franchise financial model template provides a flexible Excel environment where you can adjust every driver of your managed services operation. It features pre-filled formulas and editable assumptions that allow you to test different pricing tiers for managed IT and cybersecurity services. You can easily modify the model to reflect your specific territory, local labor rates, and lease terms to see how they impact your bottom line.

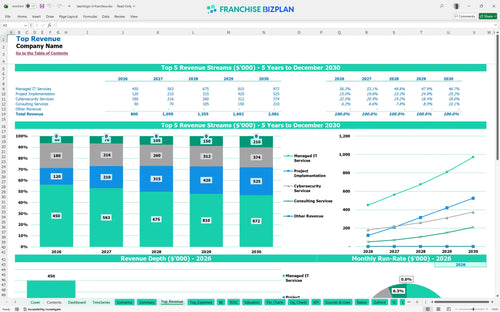
Mapping out a long-term IT managed services business plan requires looking beyond the first year of operations. This tool delivers detailed 5-year revenue projecktions, showing how your unit scales from $800,000 in Year 1 to over $2,081,000 by Year 5. By visualizing the growth of recurring revenue alongside scaling costs, you can plan for future technician hires and infrastructure upgrades with confidence.

Managing the financial obligations of a franchise system is critical for maintaining store-level margins. The model specifically tracks the 7% royalty fee and 2% marketing fund contribution, ensuring these are deducted from gross sales before you calculate your take-home pay. It also accounts for the initial $49,500 entry fee, so you understand the total capital commitment required to join the network.

This franchise startup cost calculator helps you estimate the total initial investment needed to open your doors. It breaks down the build-out for your office, the cost of your branded mobile units, and the initial inventory of computers and servers. By identifying these fixed and variable costs early, you can accurately determine the sales volume needed to reach your monthly break-even point.

Our IT franchise investment analysis uses researched benchmarks to help you sanity-check your operational assumptions. We include standard salary ranges for roles like Operations Managers at $70,000 and Senior Technicians at $65,000 to ensure your labor model is realistic for the Austin tech corridor or similar markets. This data-driven approach helps you compare your expected performance against typical industry gross margin ranges.


Simply purchase and download the financial model template, then access it instantly using Microsoft Excel or Google Sheets. No installation or technical expertise required-just open and start working.

Enter your business-specific numbers, including revenue projections, costs, and investment details. The pre-built formulas will automatically calculate financial insights, saving you time and effort.

Leverage the investor-ready format to confidently showcase your financial projections to banks, franchise representatives, or investors. Impress stakeholders with clear, data-driven insights and professional reports.

Leverage the investor-ready format to confidently present your projections to banks, franchise representatives, or investors.