
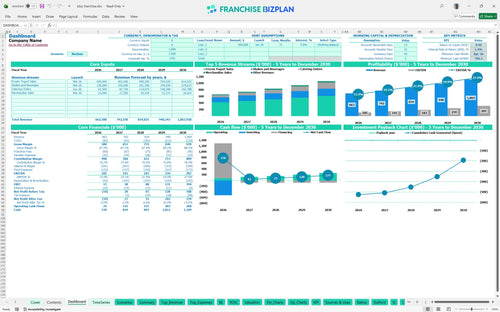
All-in-one Dashboard
Core inputs and core outputs


This comprehensive franchise unit budget and cash flow projection tool includes a franchise startup cost calculator and 5-year forecasting sheets to help you master your unit economics.
Core inputs and core outputs
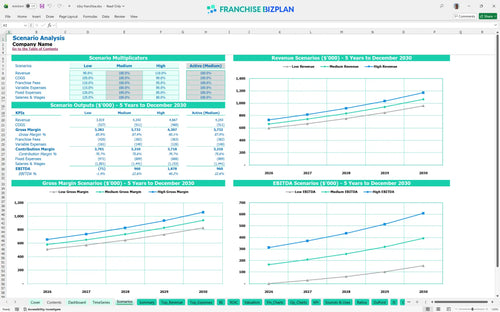
Three scenario analysis
Presentation ready
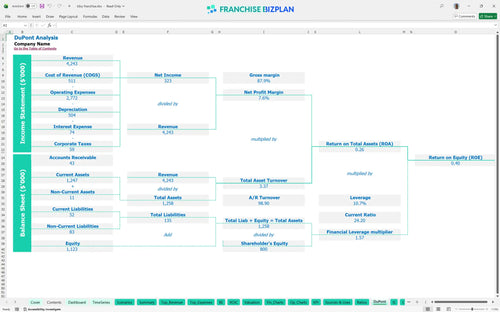
DuPont analysis
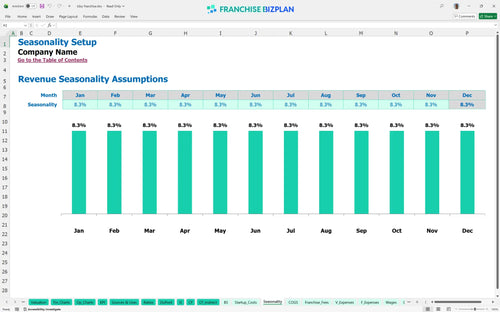
Researched revenue assumptions
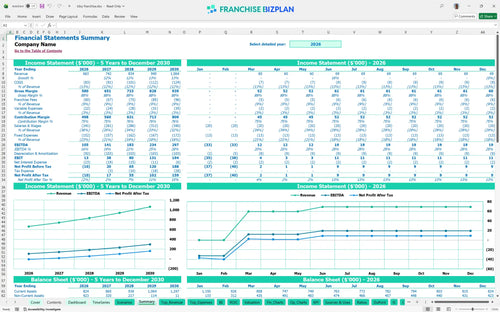
Lender-friendly financial outputs
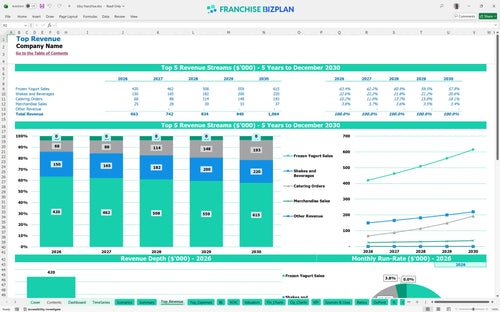
Revenue stream detailed view
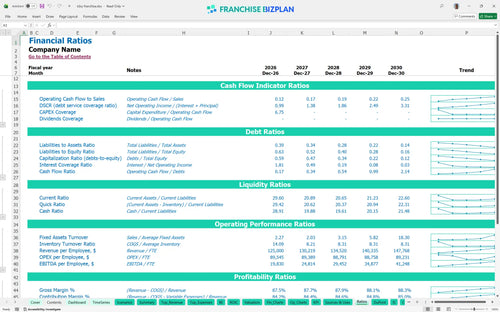
Performance metrics benchmark
We built this financial model for a dessert shop business plan using detailed research into the frozen yogurt sector. Key assumptions like the $663,000 year-one revenue and the 6% royalty fee are pre-populated and fully editable to match your specific site. This model gives you the clarity needed to manage a high-traffic retail store without the guesswork.
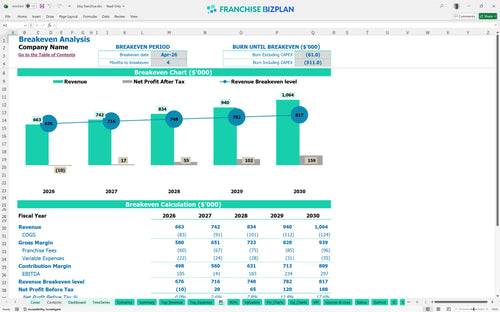
The unit shows positive EBITDA of $105,000 in its first year, scaling up to $297,000 by year five. This franchise profitability analysis suggests that while the first few months are about finding your footing, the model stabilizes quickly as catering and merchandise sales kick in. Honestly, the real margin expansion happens in years three and four as revenue climbs toward the $1M mark.
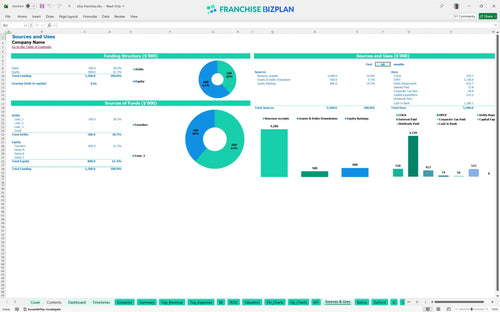
You will need approximately $515,000 in initial capital to cover the build-out and equipment before accounting for your opening cash buffer. This startup budget breakdown for independent franchise owners includes a $35,000 franchise fee and $200,000 for leasehold improvements to get that premium retail look. Still, you should defintely keep a reserve for the first few months of operations.
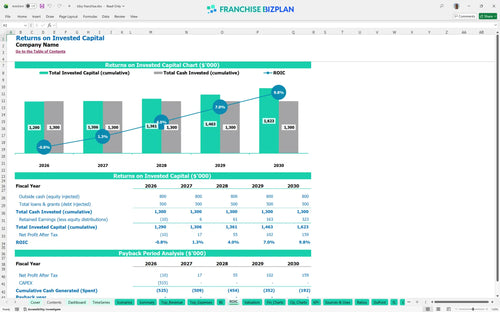
The model projects an Internal Rate of Return (IRR) of 1.38% and a Return on Equity (ROE) of 0.4. While the cash flow is steady, the payback period extends after year five due to the significant upfront investment in high-end equipment and prime real estate. This return on investment calculation assumes you are playing the long game in a high-traffic location.
The unit hits its monthly break-even point in April 2026, just four months after launch. This quick turn depends heavily on maintaining a low operating expense ratio, specifically keeping yogurt and ingredient costs around 11% of sales. If your rent at a prime location stays at $9,000, you need to hit your traffic targets early to cover those fixed costs.
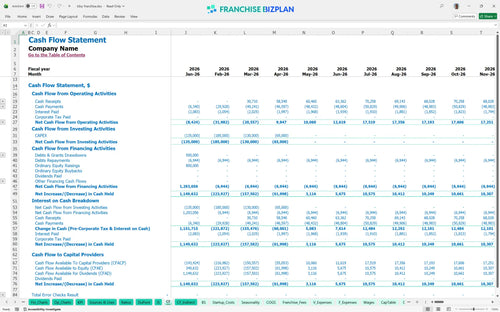
Your lowest cash point occurs in April 2026, with a minimum cash balance of $706,000 projected in the model. This estimate hides the fact that you need significant liquidity upfront to handle the $120,000 equipment spend and $200,000 build-out. To be fair, having a healthy buffer is the only way to survive the ramp-up phase without stress.
Switching between Low, Medium, and High scenarios shows how sensitive the model is to volume; a 10% drop in traffic can delay your April 2026 breakeven by several months. In the High case, year-1 revenue exceeding $663,000 significantly improves your year-1 margin and helps offset the $1.4k monthly utility bill. It's all about how to forecast revenue for a new franchise unit accurately under different market pressures.
Analyzing franchise unit profitability and margin requires a deep dive into your specific local numbers. Use this Excel template for franchise unit financial forecasting to plug in your actual lease terms and local wage rates. Plus, make sure to verify the catering demand in your specific tech corridor to ensure those revenue streams are realistic for your market.
Finance: update unit break-even and payback model by Friday
This franchise financial model template is built in Excel so you can tweak every variable to match your specific territory. It comes with pre-filled formulas for frozen yogurt sales and catering orders, but you can easily edit the assumptions to reflect your local rent or labor market. Whether you are adjusting the price per ounce or adding a second shift, the logic stays intact to give you a clear franchise unit business plan.

Plan your multi-unit growth or single-store success with detailed 5-year retail franchise financial projections that scale from $663,000 in year one to over $1 million by year five. This long-term view helps you manage capital expenditure planning and understand how your dessert shop business plan evolves as you capture more local market share. Plus, it provides a clear balance sheet view to track your equity growth over time.

Operating a brand-name unit means managing specific financial obligations like the 6% royalty and 3% marketing fund contributions. This model tracks these ongoing costs against your gross sales so you can see the real impact on your store-level margin. It's essential for estimating operating costs for a retail franchise location where brand standards and fees are non-negotiable fixed percentages.

Knowing how to calculate startup costs for a frozen yogurt franchise is the first step toward a successful launch. This tool breaks down the $515,000 initial investment-including the $35,000 franchise fee and $120,000 for specialized machines-to determine your exact break-even sales level. It helps you visualize the monthly cost structure so you know exactly when your traffic will start covering the bills.

We have integrated financial performance metrics for retail franchise owners to help you sanity-check your unit economics. From the $62,000 manager salary to the 11% yogurt ingredient cost, these benchmarks ensure your projections are grounded in reality. This allows you to compare your expected performance against typical industry ranges while creating a financial model for a high-traffic retail store.


Simply purchase and download the financial model template, then access it instantly using Microsoft Excel or Google Sheets. No installation or technical expertise required-just open and start working.

Enter your business-specific numbers, including revenue projections, costs, and investment details. The pre-built formulas will automatically calculate financial insights, saving you time and effort.

Leverage the investor-ready format to confidently showcase your financial projections to banks, franchise representatives, or investors. Impress stakeholders with clear, data-driven insights and professional reports.

Leverage the investor-ready format to confidently present your projections to banks, franchise representatives, or investors.