
All-in-one Dashboard
Core inputs and core outputs


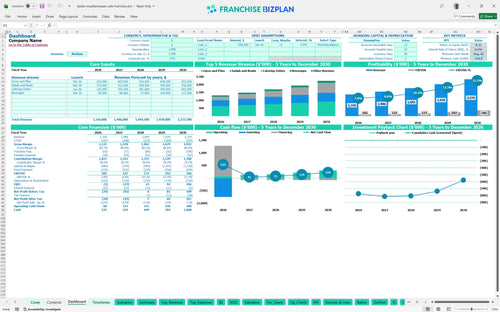
This comprehensive franchise investment calculator provides a detailed financial feasibility study for restaurant franchise operations, covering everything from CAPEX to 5-year EBITDA projections.
Core inputs and core outputs
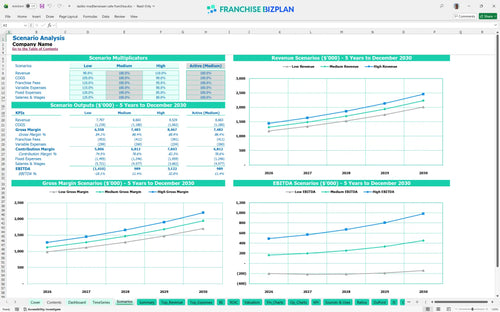
Three scenario analysis
Presentation ready
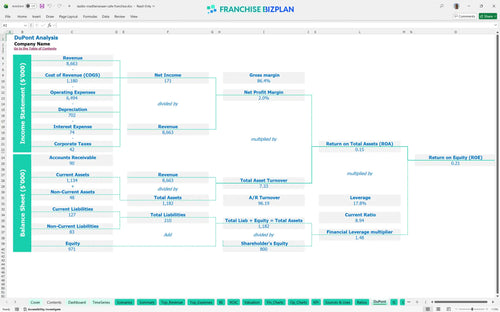
DuPont analysis
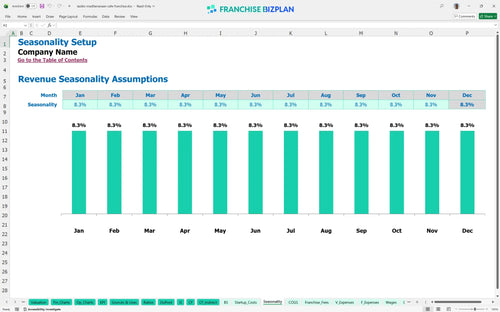
Researched revenue assumptions
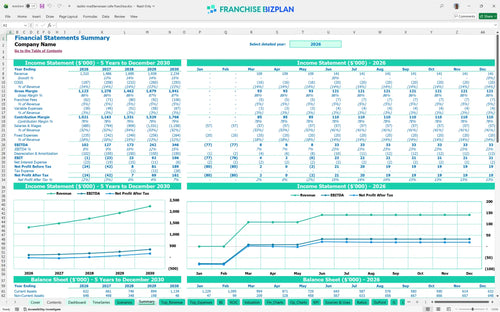
Lender-friendly financial outputs
Revenue stream detailed view
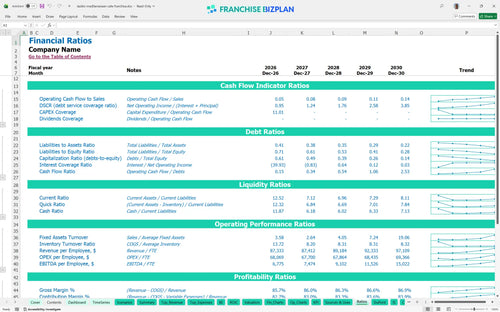
Performance metrics benchmark
We built this franchise unit financial model using our own research into the fast-casual Mediterranean sector. Key assumptions like the $1.31 million year-one revenue and the 4-month breakeven timeline are pre-populated with researched data and are fully editable to match your specific territory. This model provides a detailed financial statement template for potential owners to evaluate real-world performance metrics.
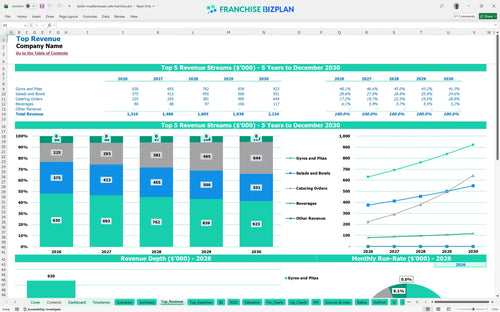
The unit reaches profitability quickly, showing a year-one EBITDA of $102,000 and scaling to $346,000 by year five. This growth is driven by a mix of gyros, salads, and a significant expansion in catering orders which grow from $150,000 to $429,000 annually. Net profit is calculated after accounting for the 4% royalty and 0.75% marketing fees. High-margin catering is the engine that transforms a good unit into a great one.
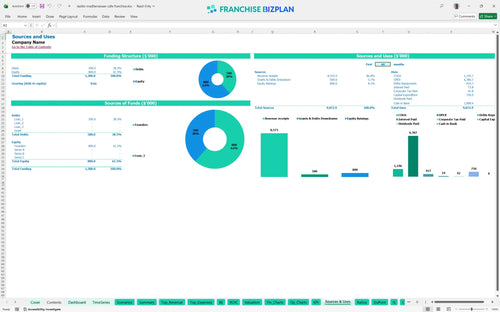
You will need approximately $750,000 in capital for the initial build-out and fees. The largest allocation goes toward leasehold improvements at $250,000, followed by $120,000 for kitchen equipment and $80,000 for grill stations. This total includes the $35,000 franchise fee and a $50,000 investment in a digital pickup lane to drive throughput. Your biggest check goes into the walls and the floors.
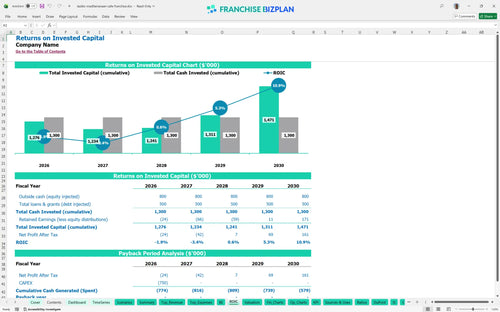
Investors can expect an Internal Rate of Return (IRR) of 45% and a Return on Equity (ROE) of 21%. While the unit generates strong annual cash flow, the full payback of the initial $750,000 investment occurs after year five due to the significant upfront CAPEX. The restaurant franchise EBITDA projection spreadsheet shows steady margin expansion as the unit matures. A 45% IRR is a strong signal for multi-unit expansion. Cash flow is king, but the exit value is the real prize.
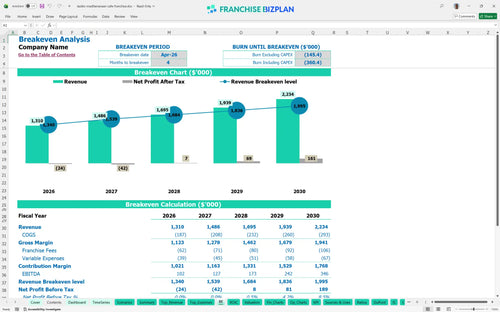
The unit hits its monthly break-even point in April 2026, just four months after opening. The primary driver for this fast ramp-up is the high average ticket from the Mueller-area demographic and the efficient 4% royalty structure. Fixed costs are anchored by a $14,000 monthly rent, meaning volume is the critical lever to cover occupancy. Speed to break-even is the best way to protect your initial liquidity.
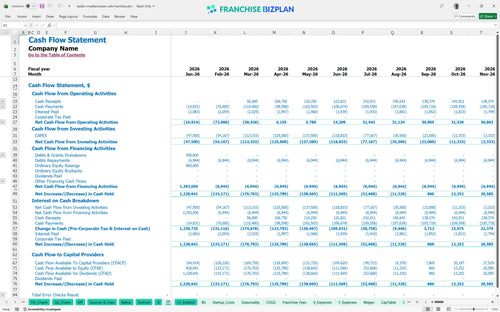
The lowest cash point is projected at $479,000 in August 2026, following the completion of major construction and the initial ramp-up phase. You should maintain a healthy buffer to handle the $14,000 monthly rent and the $25,000+ monthly frontline payroll during the first 90 days. Estimating labor and food costs for new franchise unit operations accurately is vital during this 'valley of death' period. Don't let your bank balance surprise you in month six.
In the High scenario, reaching $2.23 million in revenue by year five significantly shortens the payback period and boosts the IRR well above 45%. A Low scenario, where catering fails to launch, would see year-one EBITDA drop below $100,000, putting pressure on the $479,000 cash floor. The model allows you to toggle these variables to see how labor productivity and local marketing execution change your peak cash need. Scenarios are the difference between a plan and a prayer.
Finance: update unit break-even and payback model by Friday
This franchise financial model template is built in Excel to give you total control over your restaurant franchise business plan. You can adjust every assumption from local rent to specific menu pricing, making it easy to see how different operating scenarios impact your bottom line. The pre-filled formulas handle the heavy lifting so you can focus on the strategy. It's a flexible tool for any fast casual restaurant startup costs analysis. One size rarely fits all in food service, so we made everything editable.

Planning for the long haul requires more than just a year-one guess; this model provides detailed 5-year revenue forecasting and ROI analysis. We mapped out the growth from a $1.31 million opening year to a $2.23 million mature unit by year five. This allows multi-unit operators to see the compounding effect of store-level margin improvements over time. Seeing the five-year horizon helps you spot potential cash crunches before they happen. Long-term success is about the trend, not just the opening day.

Operating a franchise means managing specific financial obligations like the 4% royalty fee and the 0.75% brand marketing fund contribution. This model integrates these costs directly into your monthly P&L (Profit and Loss statement) so you see the true net income. We also account for the initial $35,000 franchise fee in the startup phase to ensure your capital expenditure budget is accurate. Understanding these 'off-the-top' costs is vital for a realistic franchise unit profitability analysis. Every dollar to the franchisor is a dollar you need to find in efficiency.

Knowing how to calculate startup costs for a restaurant franchise is the first step to avoiding under-capitalization. This tool aggregates leasehold improvements, kitchen equipment, and pre-opening labor into a clear total investment view. With a projected break-even point in just 4 months, you can visualize exactly when your daily sales start covering both fixed and variable expenses. Analyzing break-even point for restaurant franchise business success is the best way to sleep at night. Speed to break-even is the best indicator of a healthy site selection.

We've included best practices for franchise unit financial projections by pre-loading industry-standard benchmarks for food and labor costs. For example, food ingredients start at 12.5% of sales, which helps you sanity-check your own local supplier quotes. Comparing your projected occupancy costs against our built-in ranges ensures your rent isn't eating too much of your store-level EBITDA. Use these benchmarks to see where your unit might be leaking margin. If your numbers are way off the benchmark, you defintely need to know why.


Simply purchase and download the financial model template, then access it instantly using Microsoft Excel or Google Sheets. No installation or technical expertise required-just open and start working.

Enter your business-specific numbers, including revenue projections, costs, and investment details. The pre-built formulas will automatically calculate financial insights, saving you time and effort.

Leverage the investor-ready format to confidently showcase your financial projections to banks, franchise representatives, or investors. Impress stakeholders with clear, data-driven insights and professional reports.

Leverage the investor-ready format to confidently present your projections to banks, franchise representatives, or investors.