
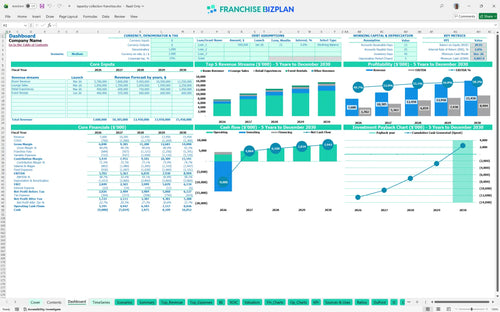
All-in-one Dashboard
Core inputs and core outputs


This hotel franchise financial model provides a complete Excel template for hotel franchise financial feasibility, covering everything from historic build-out costs to five-year P&L statements.
Core inputs and core outputs
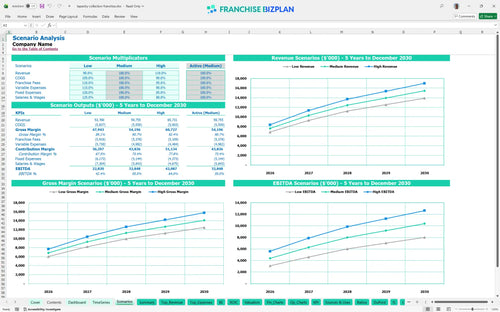
Three scenario analysis
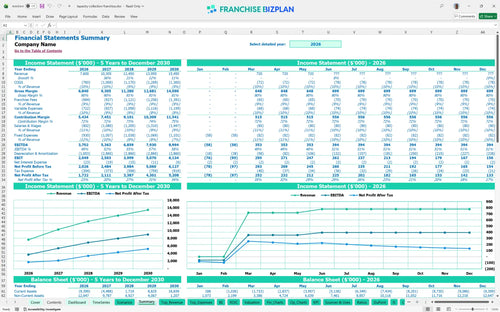
Presentation ready
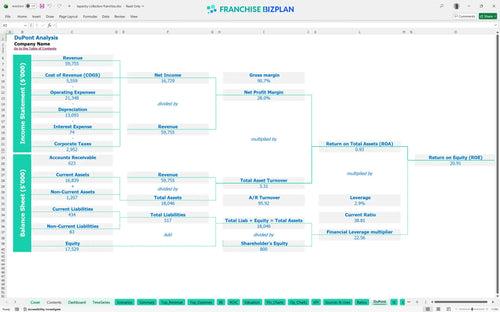
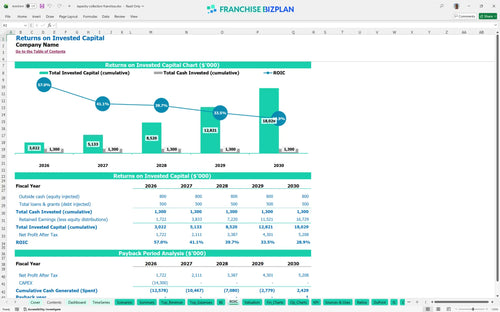
DuPont analysis
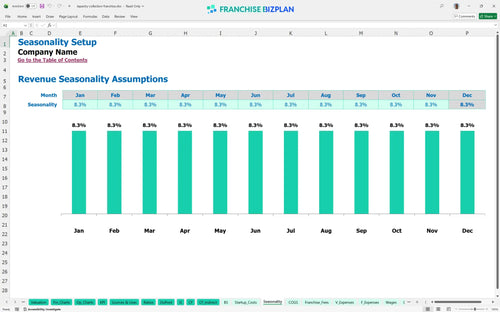
Researched revenue assumptions
Lender-friendly financial outputs
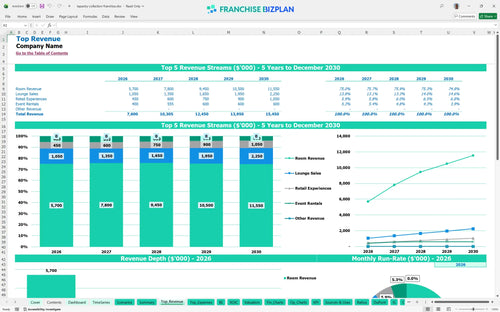
Revenue stream detailed view
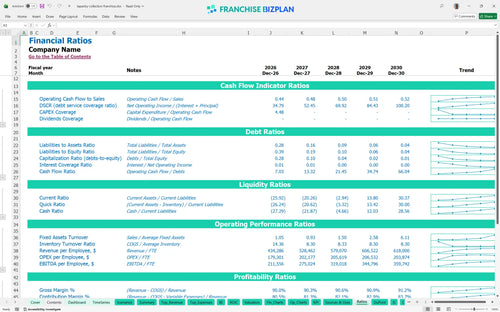
Performance metrics benchmark
We built this financial model for independent hotel brand franchise units using researched data on premium boutique operations. Key assumptions like the $100,000 franchise fee, 9% total brand fees, and a $14.3 million total CapEx (Capital Expenditure) budget are pre-populated and fully editable to match your specific property needs. With a year-one EBITDA of $3.7 million, this model shows how high-volume room sales and rooftop lounge traffic drive the unit economics.
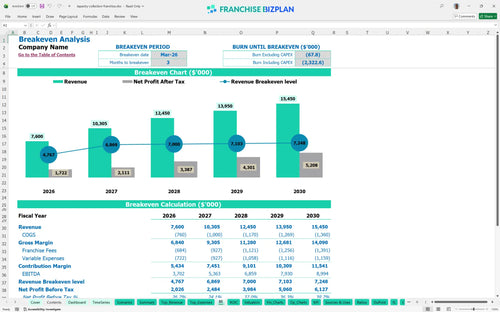
This franchise unit becomes operationally profitable in March 2026, just three months after the initial launch phase. By year three, the model projects an EBITDA of $6.85 million, though net profit is heavily influenced by the $8 million historic restoration debt service.
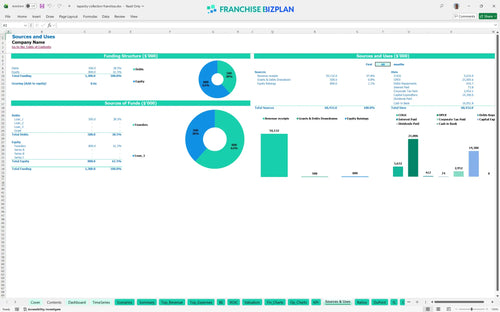
You need approximately $14.3 million to launch this unit, with the largest share going to the $8 million historic restoration and $1.8 million for room furnishings. This total includes the $100,000 franchise fee and $350,000 in pre-opening expenses to cover the ramp-up period.
Calculating ROI for luxury boutique hotel investment reveals a 5-year payback period and an Internal Rate of Return (IRR) of 2.82%. While the IRR is conservative, the 20.91% Return on Equity (ROE) shows strong performance for investors using traditional hospitality leverage.
The monthly break-even point is reached in March 2026, driven primarily by room revenue and lounge sales. The biggest hurdle to break-even is the $35,000 monthly rent combined with the 9% royalty and marketing fee burden on every dollar earned.
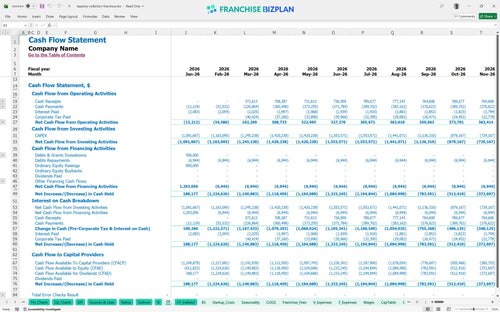
The lowest cash point is a $9.88 million deficit in December 2026, reflecting the massive cash outlay for restoration and furnishings before the $10.3 million revenue year kicks in. You defintely need a robust construction loan or equity bridge to cover these early-stage capital requirements.
A Low scenario with 10% lower occupancy can delay payback by two years and significantly increase your peak cash need. In contrast, a High scenario leveraging the rooftop lounge for event rentals can push year-5 EBITDA well past the $8.99 million base case.
This franchise unit financial model is fully customizable in Excel, featuring open formulas and editable assumptions that allow you to stress-test your specific location and market conditions. You can swap out room rates, occupancy targets, or labor costs to see exactly how they impact your bottom line in real-time.

We provide a detailed 5-year revenue and cash flow forecast that tracks your trajectory from a $7.6 million opening year to over $15.4 million at maturity. This long-term franchise unit financial projections tool is essential for mapping out the ramp-up phase and understanding when the business stabilizes after the initial restoration.

Operating under a major brand means 9% of your gross revenue-5% for royalties and 4% for the marketing fund-is committed before you pay for local utilities or staff. Estimating royalty and franchise fees for hotel business accurately ensures you understand the real economics of the brand partnership and its impact on your store-level margin.

Total startup investment for this boutique concept is heavy on the front end, particularly with an $8 million historic restoration requirement and $1.5 million in FF&E (Furniture, Fixtures, and Equipment). Our model helps you determine the exact sales volume needed to cover these high fixed costs and reach a sustainable operating level.

The model incorporates hospitality industry pro forma standards to help you sanity-check your operating assumptions against real-world boutique hotel operating expenses. We include labor benchmarks that scale with your growth, ensuring your staffing plan remains lean enough to protect margins while maintaining premium service standards.


Simply purchase and download the financial model template, then access it instantly using Microsoft Excel or Google Sheets. No installation or technical expertise required-just open and start working.

Enter your business-specific numbers, including revenue projections, costs, and investment details. The pre-built formulas will automatically calculate financial insights, saving you time and effort.

Leverage the investor-ready format to confidently showcase your financial projections to banks, franchise representatives, or investors. Impress stakeholders with clear, data-driven insights and professional reports.

Leverage the investor-ready format to confidently present your projections to banks, franchise representatives, or investors.