
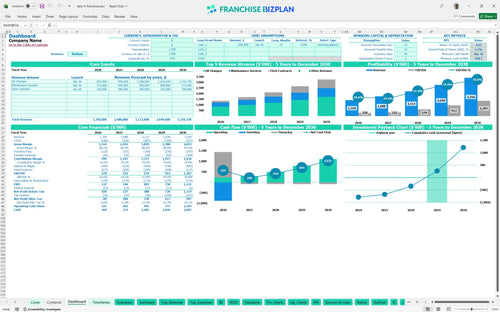
All-in-one Dashboard
Core inputs and core outputs


This financial template for multi-unit franchise expansion includes everything needed to project cash flow, analyze ROI, and manage capital expenditures for a high-volume automotive service business.
Core inputs and core outputs
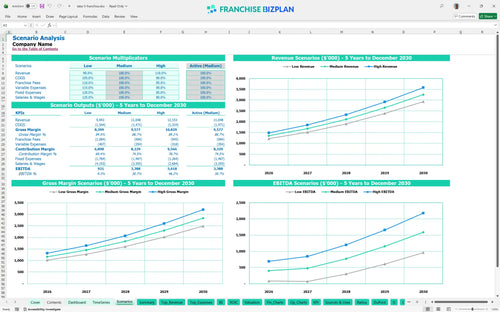
Three scenario analysis
Presentation ready
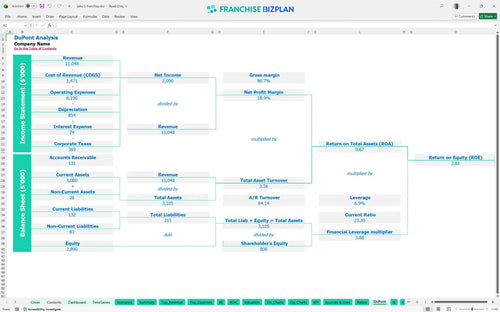
DuPont analysis
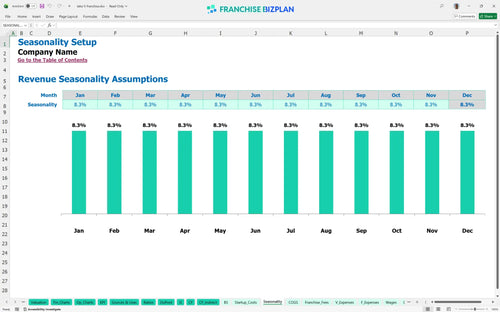
Researched revenue assumptions
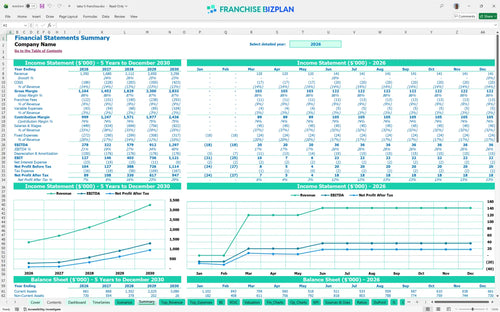
Lender-friendly financial outputs
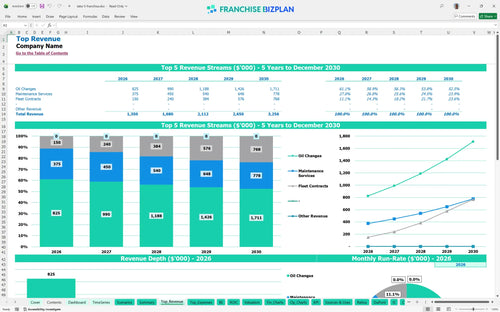
Revenue stream detailed view
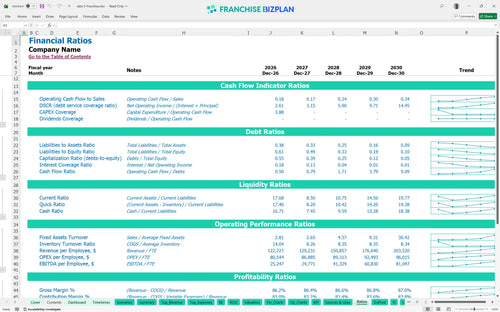
Performance metrics benchmark
We built this automotive franchise business plan tool using researched data for high-volume service centers. Key assumptions like the $35,000 initial fee and 7% royalty are pre-populated but fully editable to fit your specific deal. With Year 1 revenue starting at $1,350,000 and Year 5 EBITDA projected at $1,297,000, this model provides a professional framework for your investment analysis.
This franchise unit profitability analysis shows the business reaching positive territory by April 2026. By year five, EBITDA is projected to hit $1,297,000 as you scale fleet contracts and maintenance services. The model accounts for all COGS, including oils and fluids at 11% of sales, to keep your margins realistic.
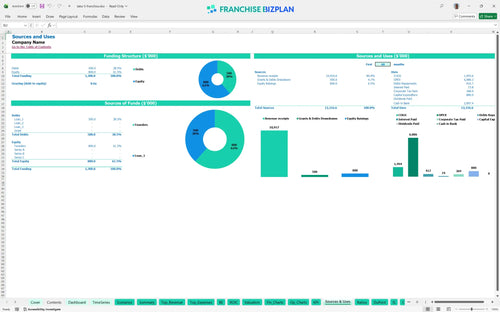
Your capital expenditure planning starts with a total investment that covers the $35,000 franchise fee and $300,000 in leasehold improvements. Major uses of funds include $250,000 for lift installations and $100,000 for oil dispensing systems. You will need to secure enough funding to cover the $411,000 minimum cash requirement during the ramp-up phase.
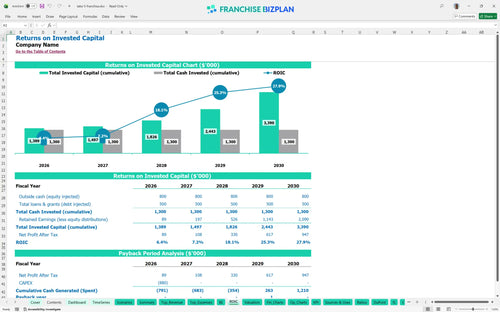
Our franchise investment ROI analysis estimates a payback period of 4 years for this concept. With an IRR of 3.69% and a return on equity of 2.61, the model shows steady growth as annual revenue climbs toward $3,256,000 by the fifth year. Honestly, these metrics provide the data-driven confidence needed for bank financing or investor pitches.
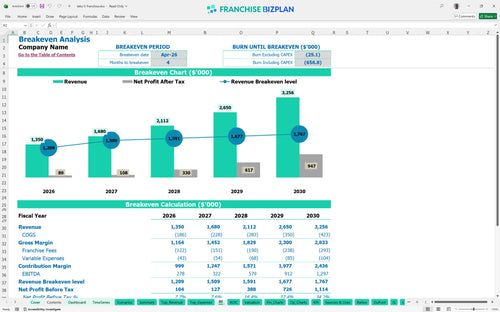
Calculating the break-even point for a new franchise location reveals that you hit the mark just 4 months after opening. The primary drivers for this are car volume and average ticket size across oil changes and maintenance. Keeping a tight lid on the $16,000 monthly rent and $2,800 utility bill is essential for hitting this goal on time.
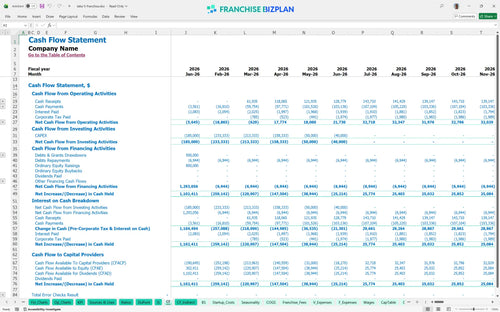
The franchise unit cash flow projection spreadsheet identifies June 2026 as your lowest cash point at $411,000. You will defintely need a solid capital buffer to navigate the first few months of operations before the unit becomes self-sustaining. Managing your $40,000 initial inventory and phasing equipment tool purchases can help protect your liquidity during this critical window.
Learning how to forecast revenue for a high-volume oil change business involves testing low, medium, and high-performance scenarios. A high-case scenario assumes better local marketing execution and higher fleet contract retention. This model shows how a 10% increase in throughput can drastically shorten your payback period and improve store-level margins.
Finance: update unit break-even and payback model by Friday.
This franchise financial model template is fully customizable in Excel, giving you total control over every line item. You can adjust pre-filled formulas and editable assumptions to match your specific territory or local labor market. It is the fastest way to build a reliable automotive service center revenue model without starting from scratch.

Planning for the long haul requires a detailed financial feasibility study for franchise ownership. This model provides comprehensive 5-year projections for revenue, costs, and cash flow to help you see the big picture. You can track how scaling from one to multiple units impacts your bottom line as revenue grows from $1.35M to over $3.2M.

Managing the franchise royalty fee calculation is simple with our automated inputs for ongoing obligations. The model tracks the 7% royalty and 2% marketing fund contributions against your gross sales. This ensures you always know exactly how much cash stays in the business after meeting brand standards and corporate fees.

Knowing how to calculate startup costs for a quick lube franchise is the first step to a successful launch. This tool breaks down the total initial investment and provides a clear break-even sales estimate. You will see exactly what volume you need to cover fixed costs like the $16,000 monthly rent and $2,800 utilities.

We use best practices for franchise unit financial planning by including built-in industry benchmarks. These metrics help you sanity-check your operating expense forecasting for items like labor and insurance. Plus, estimating operational expenses for auto maintenance franchises is easier when you can compare your numbers to typical quick lube performance ranges.


Simply purchase and download the financial model template, then access it instantly using Microsoft Excel or Google Sheets. No installation or technical expertise required-just open and start working.

Enter your business-specific numbers, including revenue projections, costs, and investment details. The pre-built formulas will automatically calculate financial insights, saving you time and effort.

Leverage the investor-ready format to confidently showcase your financial projections to banks, franchise representatives, or investors. Impress stakeholders with clear, data-driven insights and professional reports.

Leverage the investor-ready format to confidently present your projections to banks, franchise representatives, or investors.