
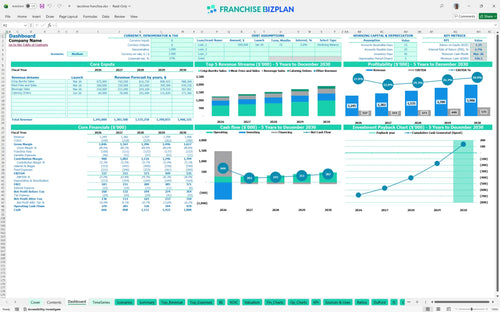
All-in-one Dashboard
Core inputs and core outputs


This Excel financial model for new franchise location provides a detailed roadmap for managing a high-volume quick-service unit with dual-lane drive-thru and catering capabilities.
Core inputs and core outputs
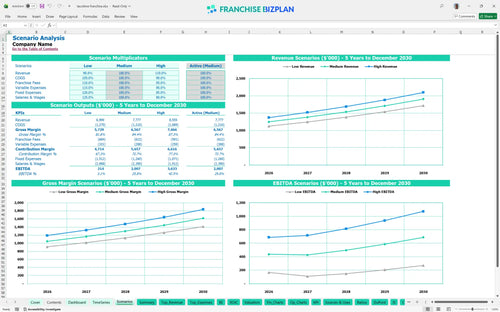
Three scenario analysis
Presentation ready
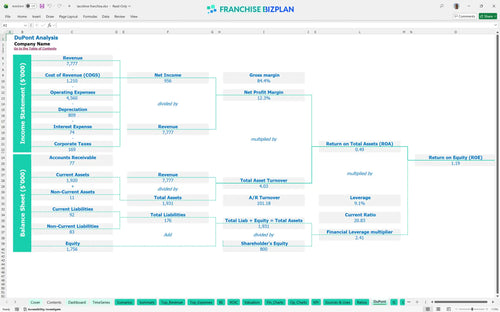
DuPont analysis
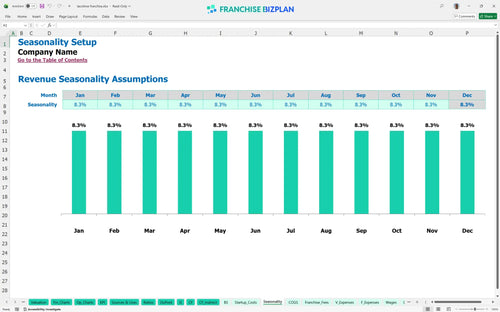
Researched revenue assumptions
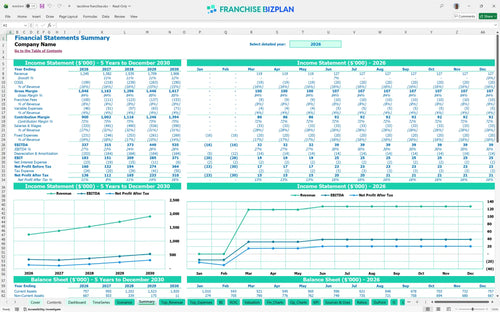
Lender-friendly financial outputs
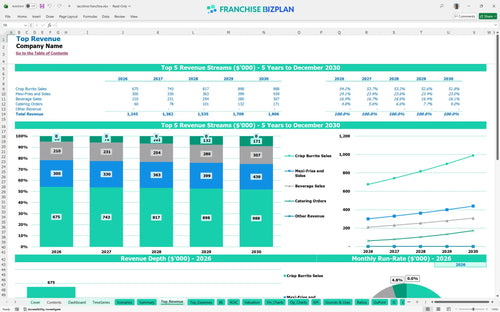
Revenue stream detailed view
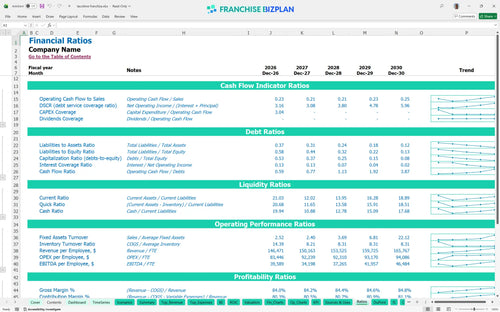
Performance metrics benchmark
We built this franchise unit financial model using our own research into high-throughput Mexican QSR operations. Key assumptions like the $1.24M Year 1 revenue and 6% royalty fee are pre-populated but fully editable to match your specific territory. Honestly, seeing a 4-month breakeven window helps you plan your initial working capital with much more confidence. One-liner: Data-driven planning beats gut-feel every single time.
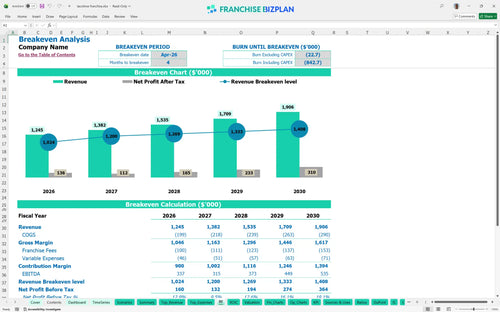
Based on the data, this unit hits its breakeven date in April 2026, just four months after launching. With EBITDA climbing from $337,000 in the first year to over $535,000 by year five, the profitability trajectory is strong if you maintain tight control over the 14% food ingredient costs. One-liner: Speed to profit is the ultimate metric for a new operator.
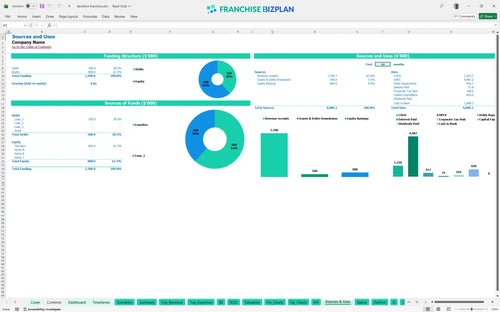
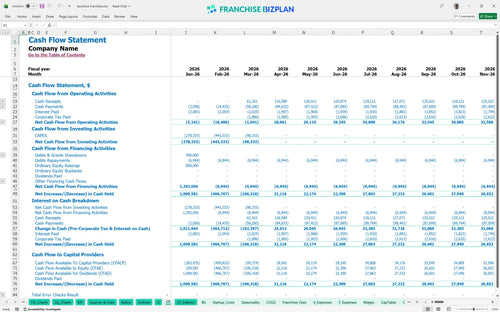
You will need a significant startup budget spreadsheet for restaurant franchise owners to cover the $820,000 in initial CAPEX. This includes the $30,000 franchise fee and $350,000 for leasehold improvements, plus a cash buffer to handle the $436,000 minimum cash point in March 2026. One-liner: Under-capitalization is the silent killer of great franchise concepts.
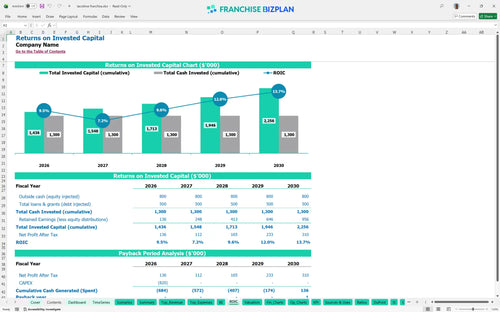
The model shows an Internal Rate of Return (IRR) of 2.65% and a Return on Equity (ROE) of 1.19 over the five-year period. While the 5-year payback period is standard for a heavy-build QSR, the steady EBITDA growth suggests long-term value for multi-unit operators. One-liner: Patience in payback leads to permanent cash flow.
To cover your fixed costs-led by the $14,000 monthly rent and $68,000 manager salary-you need to hit your sales targets by month four. Estimating operating expenses for a drive-thru franchise is tricky, but the high-throughput dual-lane setup is the primary lever for hitting that volume. One-liner: Throughput in the drive-thru is the engine of your break-even strategy.
Your lowest cash point occurs in March 2026 at $436,000, right as full operations commence. If construction takes 60 days longer than planned, your working capital will defintely feel the squeeze, so keeping a 10% contingency fund is a smart move. One-liner: Cash is oxygen; don't let your build-out suck the room dry.
Analyzing franchise unit economics for multi-unit operators requires looking at Low, Medium, and High cases. A 10% drop in revenue or a spike in food costs can delay your payback period past year five, while hitting the High case through better local marketing execution significantly boosts Year 1 EBITDA. One-liner: Plan for the worst, but execute for the High case.
Finance: update unit break-even and payback model by Friday
This franchise financial model is built in Excel with open formulas, allowing you to tweak every assumption from burrito pricing to hourly wages for crew members. It is a flexible franchise business plan template that helps you stress-test different scenarios before you sign a lease or commit capital to a new territory. To be fair, a model is only as good as the data you put in, so we made sure every cell is editable. One-liner: Your local market isn't a spreadsheet, so your model shouldn't be a black box.

Mapping out a 5-year trajectory is essential for understanding how scaling revenue from $1.24M to $1.9M impacts your bottom line. This restaurant financial projection model tracks EBITDA growth and cash flow as your unit matures and catering orders ramp up over time. Still, you need to watch the out-years closely as labor and food costs fluctuate. One-liner: Long-term planning turns a single store into a sustainable multi-unit empire.

This tool simplifies your franchise disclosure document analysis by hard-coding the 6% royalty and 2% marketing fund into the monthly profit and loss statement. You will see exactly how much cash leaves the business for brand support before you pay your own bills or take a draw. Honestly, these fees are the price of brand power, but they must be managed against store-level margins. One-liner: Royalties are a fixed reality that demand high-volume execution.

Figuring out how to calculate startup costs for a quick service restaurant franchise is the first hurdle for any operator. This model aggregates leasehold improvements, kitchen equipment, and drive-thru construction to show you the exact sales volume needed to cover your $14,000 monthly rent. Plus, it helps you visualize the gap between opening day and your first profitable month. One-liner: Knowing your break-even number is the only way to sleep at night during ramp-up.

We have included benchmarks to help you evaluate investment returns for a food franchise against industry standards. If your food ingredients hit 14% while the model suggests a different range, you know exactly where to tighten your inventory management or portion control. This financial projection template for fast casual restaurant use makes it easy to spot margin leaks before they become floods. One-liner: Benchmarks tell you if you are running a business or just a hobby.


Simply purchase and download the financial model template, then access it instantly using Microsoft Excel or Google Sheets. No installation or technical expertise required-just open and start working.

Enter your business-specific numbers, including revenue projections, costs, and investment details. The pre-built formulas will automatically calculate financial insights, saving you time and effort.

Leverage the investor-ready format to confidently showcase your financial projections to banks, franchise representatives, or investors. Impress stakeholders with clear, data-driven insights and professional reports.

Leverage the investor-ready format to confidently present your projections to banks, franchise representatives, or investors.