
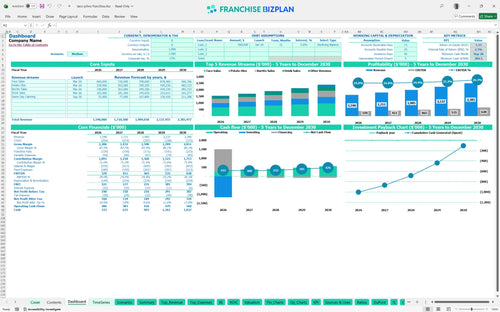
All-in-one Dashboard
Core inputs and core outputs


This financial model template for new restaurant franchise units provides a comprehensive framework for forecasting revenue, managing expenses, and evaluating long-term investment viability.
Core inputs and core outputs
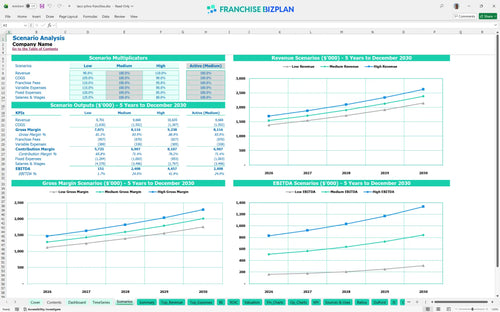
Three scenario analysis
Presentation ready
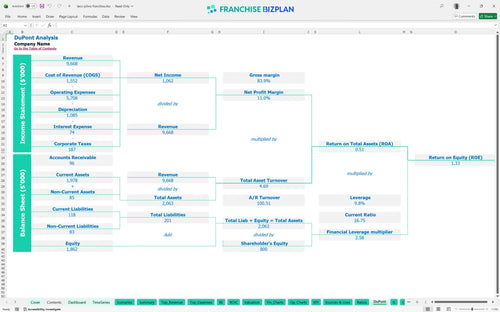
DuPont analysis
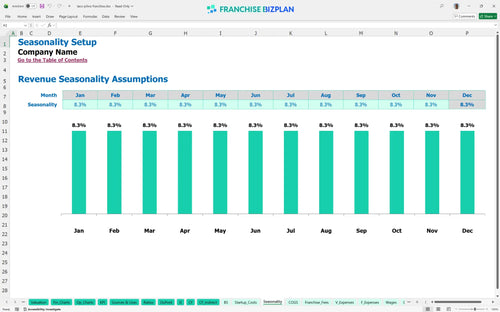
Researched revenue assumptions
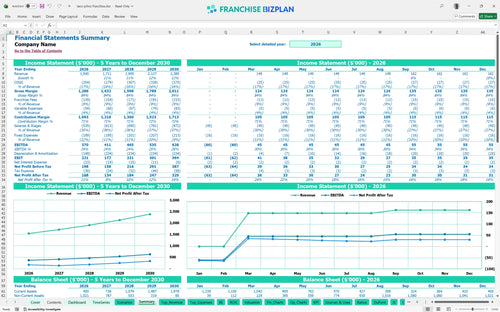
Lender-friendly financial outputs
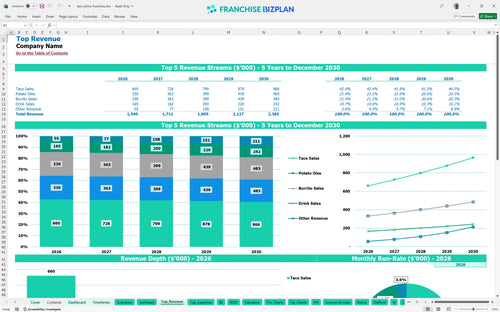
Revenue stream detailed view
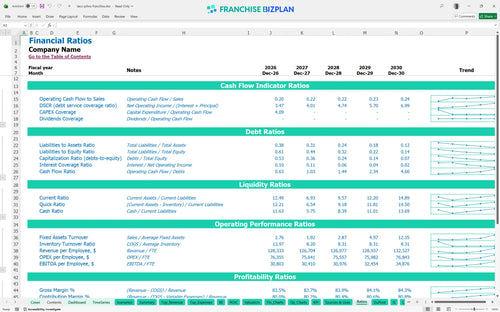
Performance metrics benchmark
We built this franchise unit profitability analysis using detailed research into the West-Mex QSR sector. Key assumptions, including the $1.54M Year 1 revenue target and the 9% total brand fee structure, are pre-populated and fully editable to reflect your local Broadway Avenue market conditions.
The unit shows positive EBITDA of $370,000 in the first year of operations. This early profitability is driven by high-volume signature items like Potato Oles and a lean food cost starting at 14%. By Year 5, annual EBITDA is projected to reach $628,000 as the location matures and catering revenue scales.
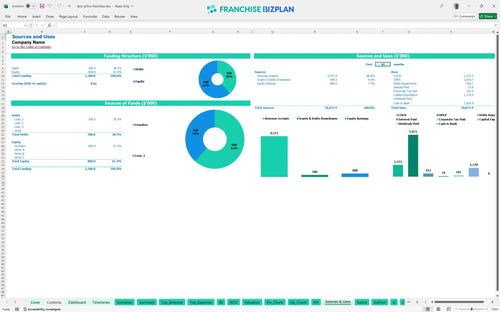
Launching this unit requires a restaurant capital expenditure budget of approximately $1.17M. This covers the $40,000 initial fee and heavy infrastructure like the $320,000 dual-lane drive-thru. You should also plan for a minimum cash buffer of $203,000 to handle the initial ramp-up phase through the first few months of trading.
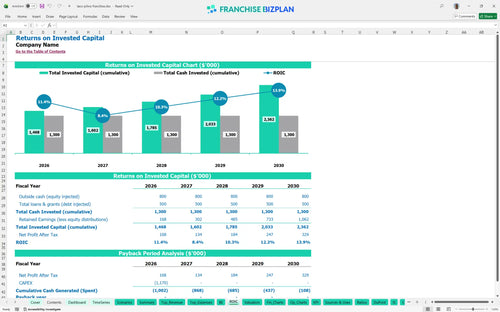
When evaluating franchise unit investment returns, the model shows an Internal Rate of Return (IRR) of 2.28% and a Return on Equity (ROE) of 1.33. While the unit generates strong annual cash flow, the significant upfront capital for drive-thru and leaseholds means the full payback of the initial investment occurs after Year 5.
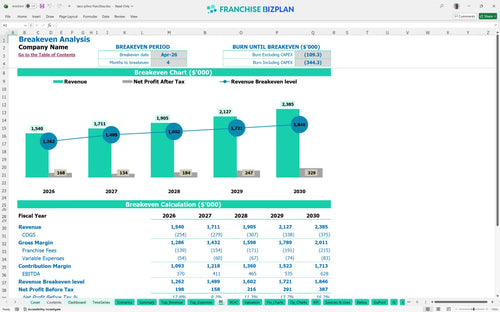
Building a financial plan for a drive-thru restaurant shows a break-even date of April 2026, roughly 4 months after the initial launch activities begin. This quick move to covering monthly operating costs depends on hitting the $1.54M Year 1 revenue target through efficient throughput and high average tickets during peak student hours.
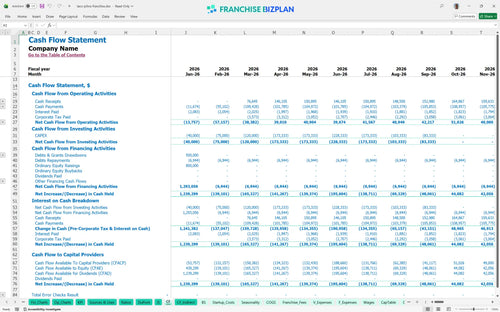
The lowest cash point is expected in September 2026, with a minimum balance of $203,000. You will defintely need to monitor liquidity closely during the first six months as you staff up for late-night leads and shift supervisors. Estimating labor costs for late-night restaurant operations is vital here to ensure you don't overspend before the revenue fully ramps.
Analyzing restaurant profit margins for fast food units reveals that a 10% drop in revenue significantly delays the break-even point and tightens the cash buffer. Conversely, the High scenario assumes better local marketing execution and higher 'Game Day' bundle sales, which could push Year 1 EBITDA well above the $370,000 baseline. This franchise investment feasibility study template allows you to toggle these variables instantly.
Finance: update unit break-even and payback model by Friday.
This franchise financial model template is a fully customizable Excel tool designed for QSR operators. It features pre-filled formulas and editable assumptions, allowing you to adapt the numbers to your specific territory, local rent, and labor market. Whether you are adjusting the QSR financial projection spreadsheet for a single unit or a small cluster, the logic remains transparent and easy to modify.

Plan your long-term expansion with a detailed 5-year fast food franchise business plan. The model tracks revenue growth from $1.54M in Year 1 to over $2.38M by Year 5, providing a clear view of cash flow and net profit. This helps multi-unit franchise accounting by showing how individual store performance contributes to the overall health of your business over a multi-year horizon.

Managing the franchise royalty fee structure is critical for maintaining store-level margins. This model automatically calculates the 5% royalty and 4% marketing fund contributions based on your monthly sales volume. By understanding franchise royalty and marketing fees upfront, you can see exactly how much cash stays in the unit after meeting your brand obligations.

Before signing a lease, you need to know how to calculate startup costs for a fast food franchise. This model aggregates restaurant franchise startup costs, including the $450,000 leasehold improvement and $320,000 drive-thru construction. It maps these against your projected sales to determine the exact volume required to cover your fixed and variable operating expenses.

Use unit level economics to sanity-check your performance against industry standards. The model includes benchmarks for food ingredients, which start at 14% of sales, and packaging at 2.5%. These built-in metrics help you identify margin leaks in your QSR operational expenses and ensure your labor model is efficient enough to support late-night and game-day peaks.


Simply purchase and download the financial model template, then access it instantly using Microsoft Excel or Google Sheets. No installation or technical expertise required-just open and start working.

Enter your business-specific numbers, including revenue projections, costs, and investment details. The pre-built formulas will automatically calculate financial insights, saving you time and effort.

Leverage the investor-ready format to confidently showcase your financial projections to banks, franchise representatives, or investors. Impress stakeholders with clear, data-driven insights and professional reports.

Leverage the investor-ready format to confidently present your projections to banks, franchise representatives, or investors.