
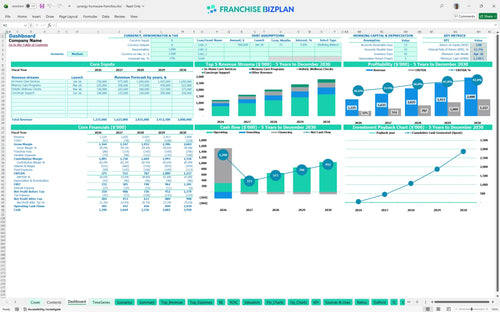
All-in-one Dashboard
Core inputs and core outputs


This comprehensive franchise unit financial model template provides a robust Excel-based toolkit for projecting revenue, managing expenses, and analyzing the long-term profitability of a senior care territory.
Core inputs and core outputs
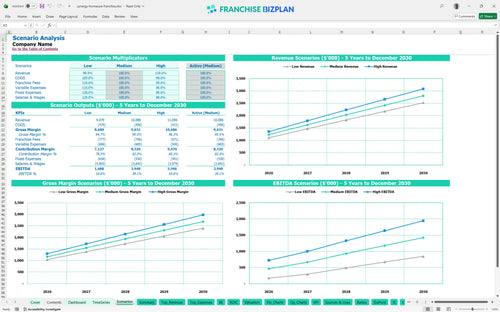
Three scenario analysis
Presentation ready
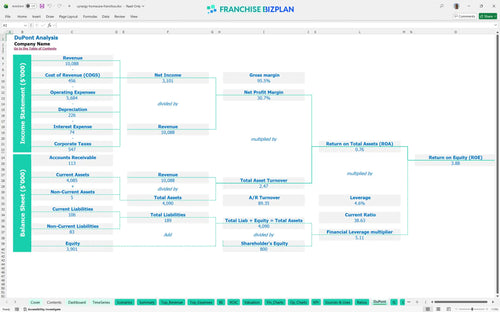
DuPont analysis
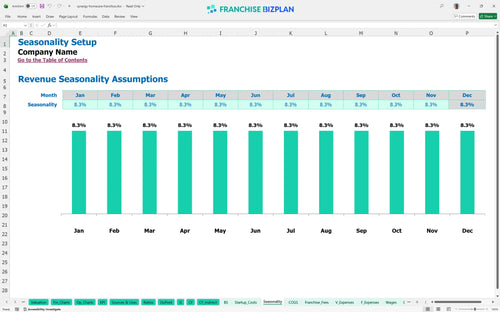
Researched revenue assumptions
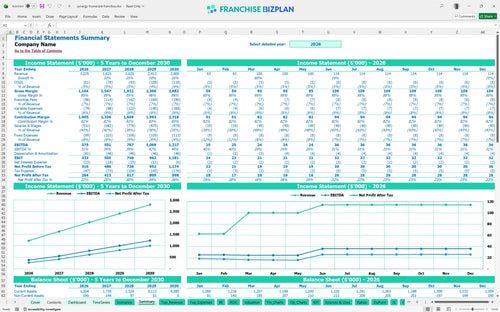
Lender-friendly financial outputs
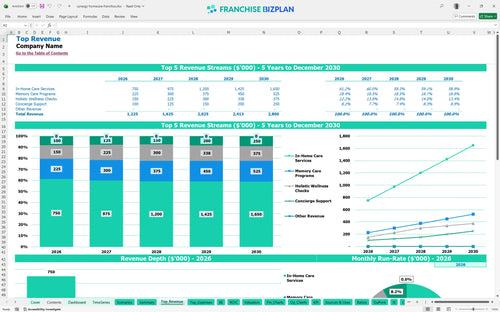
Revenue stream detailed view
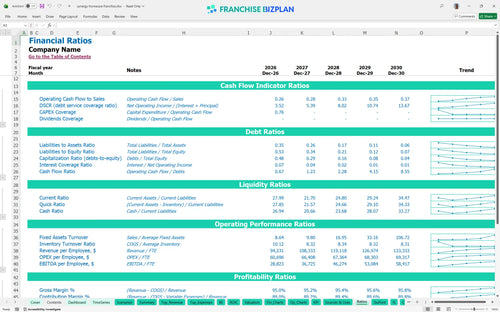
Performance metrics benchmark
We built this franchise unit financial model using extensive research into the senior care sector to provide a realistic roadmap for owners. Key assumptions for revenue drivers like holistic wellness checks and concierge support are pre-populated and fully editable to match your local Scottsdale or US-based market. With a year-one EBITDA of $375,000 and a clear path to $1.2 million by year five, this model provides the data-driven confidence you need to move forward.
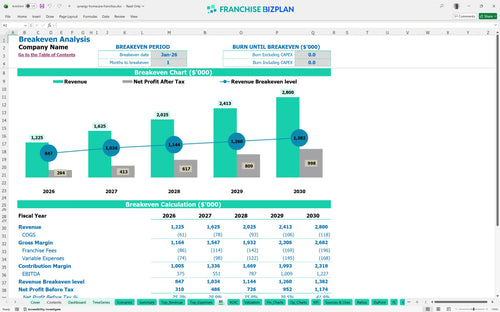
This unit reaches profitability almost immediately, with a break-even date of January 2026. After accounting for the 5% royalty and 2% marketing fees, the profitability analysis for non-medical home care agency shows EBITDA climbing from $375,000 in the first year to $1,227,000 by year five. Speed to profit is the ultimate metric here.
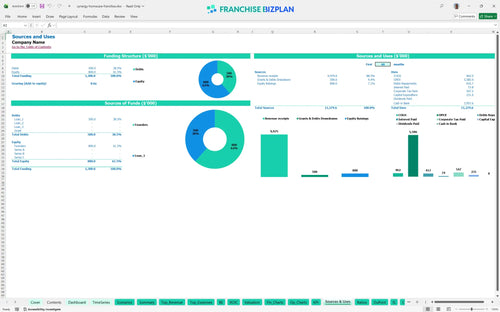
Launching this unit requires a total initial investment that covers the $52,500 franchise fee and $45,000 for office fit-out. The startup budget template for senior home care franchise also includes $38,000 for company vehicles and $20,000 for launch marketing to secure early referrals. Capital is your fuel; don't run out before the engine starts.
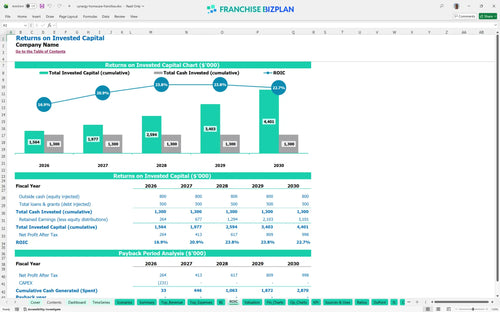
Investors can expect an Internal Rate of Return (IRR) of 15.68% and a Return on Equity (ROE) of 3.88. While the model shows a payback period extending after year five, the significant EBITDA growth suggests a strong exit multiple for multi-unit operators. Patience is defintely required for the full exit multiple.
The unit hits its monthly break-even point in January 2026, just one month after the primary service launch. The home care franchise unit economic performance metrics indicate that caregiver labor and the 7% total franchise fee burden are the primary drivers of the break-even level. Volume cures most margin headaches.
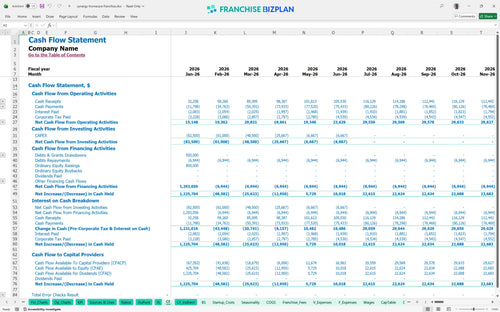
The lowest cash point occurs in April 2026, with a minimum cash balance of $1,139,000. You should maintain a healthy buffer during the first six months to handle the ramp-up of caregiver hiring and marketing spend. Liquidity is your best friend during the ramp-up phase.
Financial projections for concierge home care business show that a High scenario significantly pulls forward the payback period through higher average tickets. Conversely, the Low scenario increases the peak cash need if client acquisition lags behind the 17-FTE caregiver hiring plan. Planning for the worst makes the best even better.
This home care franchise financial model is a flexible Excel framework designed for rapid adjustments to your specific territory. It features pre-filled formulas and editable assumptions for revenue streams like in-home care and memory care, allowing you to simulate various operating scenarios. You can easily modify staffing levels, hourly rates, and payroll taxes to see how they impact your bottom line in real-time. A solid model is the backbone of any successful home care franchise business plan.

Plan for long-term growth with detailed senior care franchise financial projections that span sixty months of operation. The model tracks revenue growth from an initial $1.22 million in year one to over $2.8 million by year five, providing a clear view of your scaling potential. It integrates cash flow, profit and loss, and balance sheet views to ensure you understand the long-term health of your unit or multi-unit chain. Long-term visibility helps you stay ahead of capital needs.

Managing the real economics of a franchise requires precise tracking of your obligations to the brand. This tool automatically calculates the 5% royalty fee and 2% marketing fund contribution based on your monthly gross sales. It also accounts for the initial $52,500 franchise fee, ensuring these costs are baked into your cash flow from day one. Knowing your true contribution margin after fees is essential for healthcare franchise financial forecasting.

Estimating your total initial investment is the first step toward a successful launch. The model includes a franchise startup cost template that covers everything from office fit-out to IT equipment and launch marketing. It identifies the exact sales volume needed to cover your $4,800 monthly rent and other fixed costs, providing a clear target for your first year of operation. Break-even is the first major milestone on your path to success.

Sanity-check your numbers using built-in benchmarks for the non-medical home care business model. The model provides typical ranges for caregiver labor costs and gross margins, helping you identify if your projections are too optimistic or conservative. You can compare your expected performance against industry standards for occupancy and revenue per client to ensure your plan is realistic. Benchmarks keep your financial expectations grounded in reality.


Simply purchase and download the financial model template, then access it instantly using Microsoft Excel or Google Sheets. No installation or technical expertise required-just open and start working.

Enter your business-specific numbers, including revenue projections, costs, and investment details. The pre-built formulas will automatically calculate financial insights, saving you time and effort.

Leverage the investor-ready format to confidently showcase your financial projections to banks, franchise representatives, or investors. Impress stakeholders with clear, data-driven insights and professional reports.

Leverage the investor-ready format to confidently present your projections to banks, franchise representatives, or investors.