
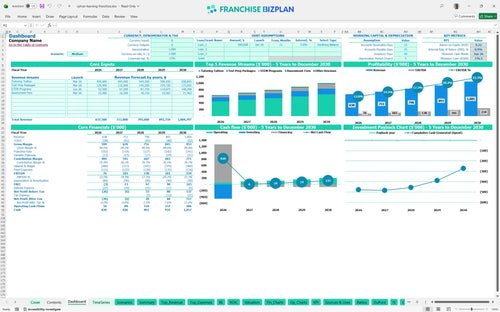
All-in-one Dashboard
Core inputs and core outputs


This template provides a complete financial forecasting and ROI calculator for tutoring center investment to help owners make data-driven decisions.
Core inputs and core outputs
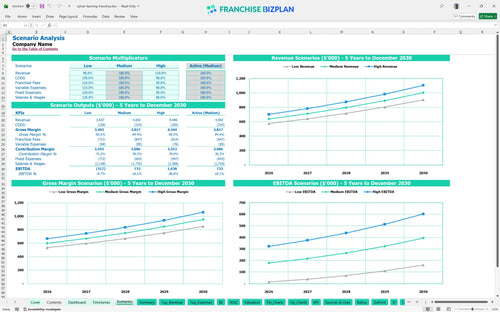
Three scenario analysis
Presentation ready
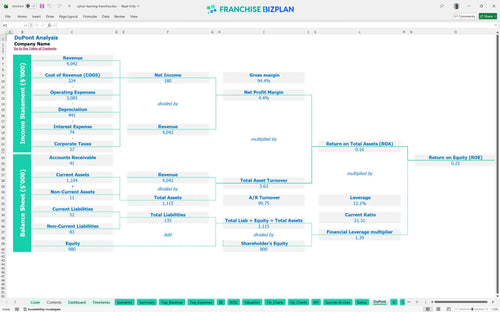
DuPont analysis
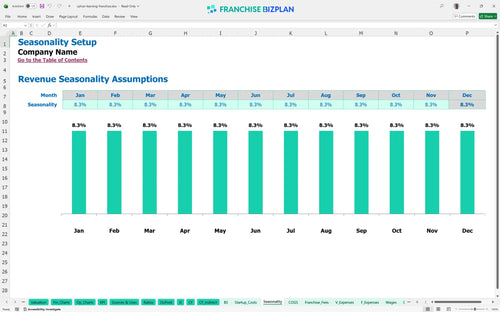
Researched revenue assumptions
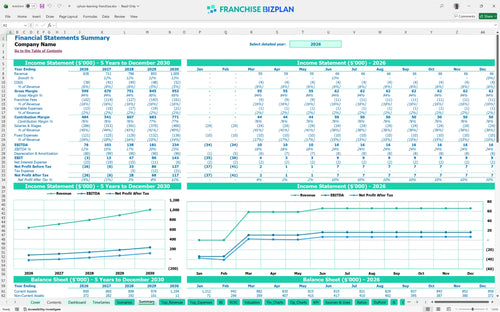
Lender-friendly financial outputs
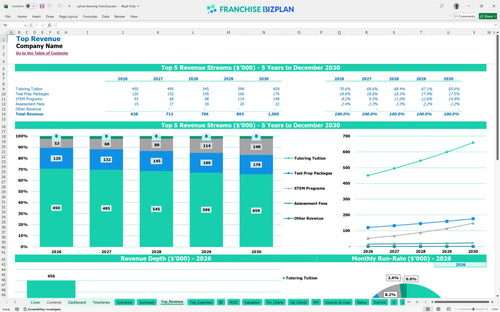
Revenue stream detailed view
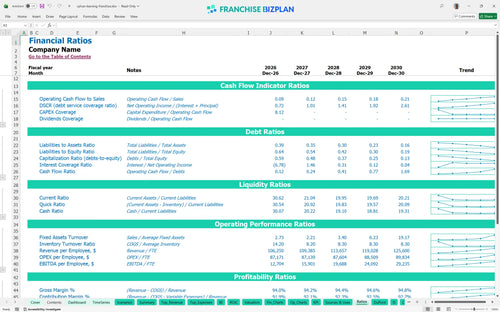
Performance metrics benchmark
We developed this franchise unit financial model using detailed research into the supplemental education market and unit economics. Key assumptions-including the $36,900 franchise fee, 11% royalty, and five-year revenue growth from $638,000 to over $1,000,000-are pre-populated and fully editable. This tool provides a practical framework for analyzing franchise royalty and tech fees while planning your path to a $234,000 annual EBITDA.
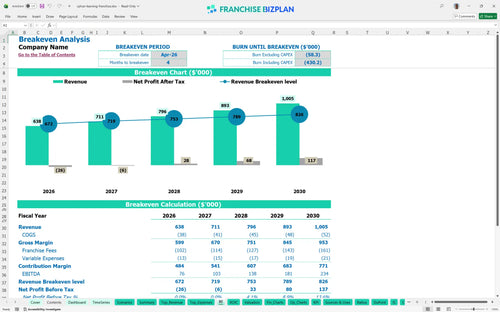
The unit reaches its break-even date in April 2026, just four months after launching. Profitability scales significantly as revenue grows from $638,000 in year one to over $1 million by year five, with EBITDA margins improving as learning material costs drop to 4.2%. Here's the quick math: once you clear your fixed monthly overhead of roughly $10,000 plus salaries, the incremental margin on every new student is quite high.
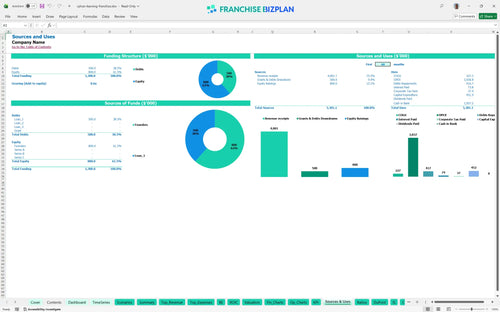
You need a total initial investment of approximately $451,900 to launch this unit in the US market. The largest allocation goes toward $200,000 in leasehold improvements and $60,000 for technology like computers and laptops. Honestly, the build-out and the $36,900 franchise fee represent the bulk of your upfront cash need, so having a solid buffer is defintely recommended for the first 90 days.
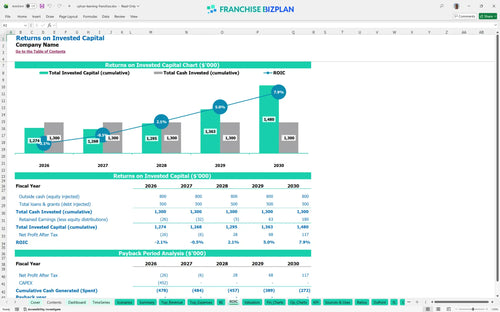
Based on the five-year forecast, the model shows an Internal Rate of Return (IRR) of 0.94% and a Return on Equity (ROE) of 0.22. While the full payback of the $451,900 investment occurs after year five, the business generates a strong $234,000 in annual EBITDA by that time. Still, what this estimate hides is the potential resale value of a mature, cash-flowing education center in a prime territory.
The monthly break-even point is reached when revenue covers the $6,500 rent, $10,000+ in management salaries, and the 16% combined royalty and marketing fees. Labor is the most critical driver here; if you don't manage the tutor-to-student ratio effectively, your variable costs will eat the margin before you hit your targets. Plus, keeping a close eye on the $800 monthly local marketing spend is vital for maintaining the student pipeline.
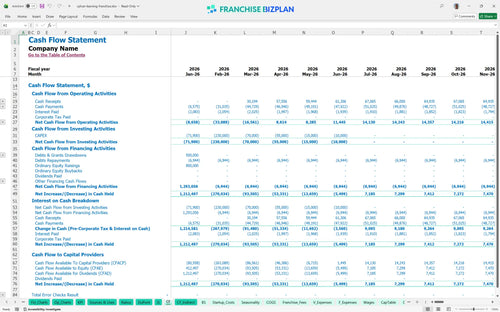
The lowest cash point occurs in June 2026, with a minimum cash balance of $776,000, assuming you started with full funding. You need enough runway to survive the initial four-month ramp-up before the business becomes self-sustaining. If the SylvanSync implementation or staff training takes longer than planned, the working capital pressure will rise, so keeping an extra cash reserve is a smart move.
In the High scenario, aggressive growth in STEM and Test Prep packages can push year-five revenue well past $1M, significantly boosting the IRR. However, in a Low scenario, the high fixed costs of a prime location rent and $120,000 in director salaries can make the margin very thin. To be fair, the difference between the two usually depends on local marketing execution and student retention rates in the first year.
Finance: update unit break-even and payback model by Friday
This franchise financial model is built in Excel with fully editable assumptions, allowing you to adjust every driver from tutor hourly rates to local occupancy costs. You can easily modify the pre-filled formulas to test different enrollment levels and pricing tiers, ensuring the tutoring center financial model fits your specific territory and market demand.

Long-term planning is essential in the education sector, and this tool provides a detailed 5-year outlook on revenue, expenses, and cash flow. By mapping out growth from year one to year five, you can see how scaling your student base impacts your store-level margin and overall franchise profitability analysis.

Operating a branded center means managing specific financial obligations like the 11% royalty and 5% marketing fund contributions. This model tracks these ongoing costs alongside the initial franchise fee, giving you a transparent view of the real economics after all brand-related expenses are paid.

Estimating franchise startup costs is the first step toward a successful launch, covering everything from leasehold improvements to initial materials. Our break-even analysis helps you identify the exact monthly revenue needed to cover fixed costs like the $6,500 prime location rent and staff salaries.

The model includes industry-standard benchmarks for labor and occupancy to help you sanity-check your education franchise business plan. Comparing your expected performance against these ranges ensures your projections for tutor wages and administrative overhead remain realistic and competitive.


Simply purchase and download the financial model template, then access it instantly using Microsoft Excel or Google Sheets. No installation or technical expertise required-just open and start working.

Enter your business-specific numbers, including revenue projections, costs, and investment details. The pre-built formulas will automatically calculate financial insights, saving you time and effort.

Leverage the investor-ready format to confidently showcase your financial projections to banks, franchise representatives, or investors. Impress stakeholders with clear, data-driven insights and professional reports.

Leverage the investor-ready format to confidently present your projections to banks, franchise representatives, or investors.