
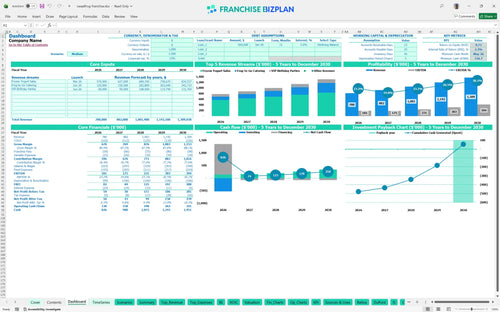
All-in-one Dashboard
Core inputs and core outputs


This financial model template for self-serve yogurt shop includes a comprehensive Excel framework for forecasting revenue, expenses, startup costs, and 5-year cash flow for a dessert unit.
Core inputs and core outputs
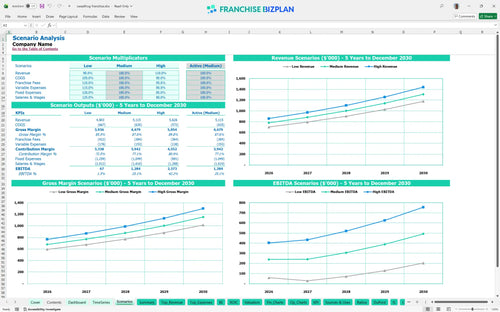
Three scenario analysis
Presentation ready
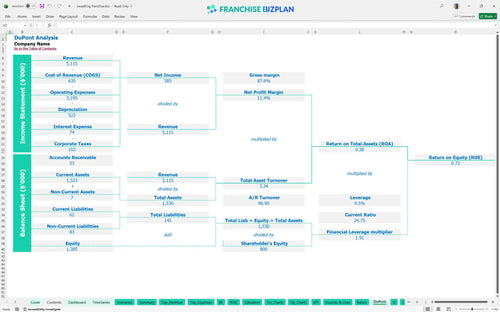
DuPont analysis
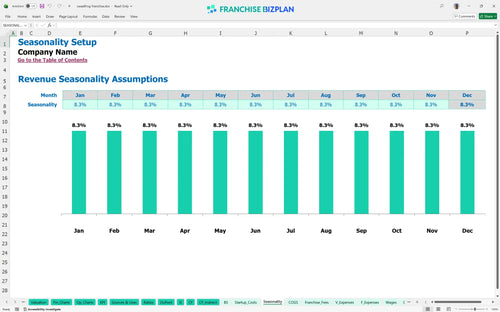
Researched revenue assumptions
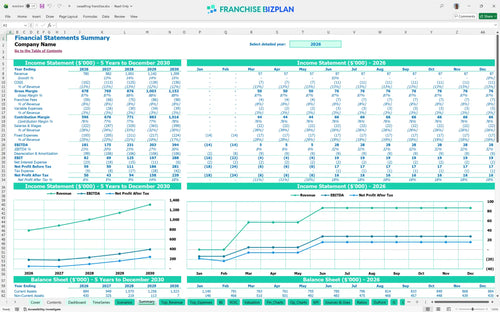
Lender-friendly financial outputs
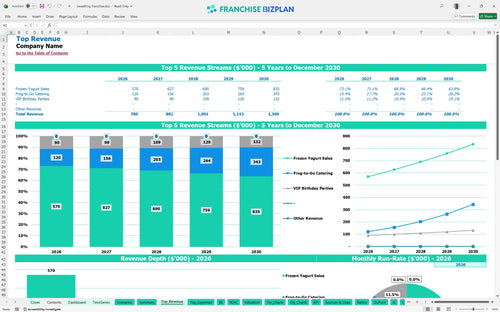
Revenue stream detailed view
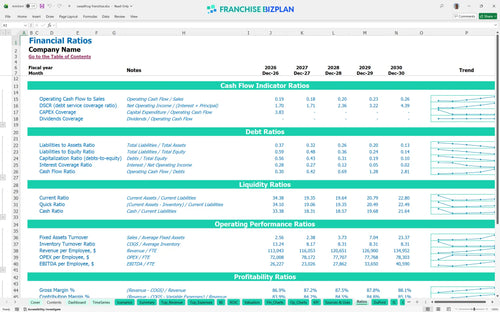
Performance metrics benchmark
We built this franchise unit financial model using our own research to help you evaluate a frozen yogurt shop investment. Key assumptions like the $30,000 franchise fee and revenue from VIP birthday parties are pre-populated with researched data specific to sweetFrog Franchise franchise unit and are fully editable. With Year 1 revenue projected at $780,000 and EBITDA at $181,000, this tool provides a clear baseline for your financial planning.
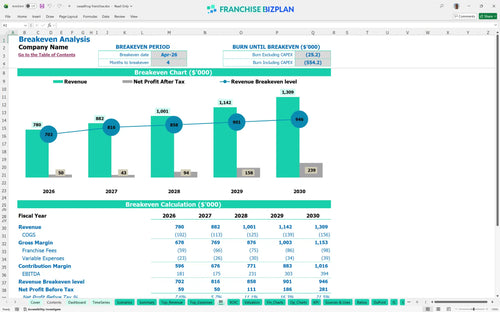
Based on the data, this unit hits its break-even point in April 2026, just four months after the March launch. Estimating profitability for a retail dessert franchise requires looking at the climb from $780,000 in Year 1 to over $1.3 million by Year 5. Profit is a marathon, not a sprint.
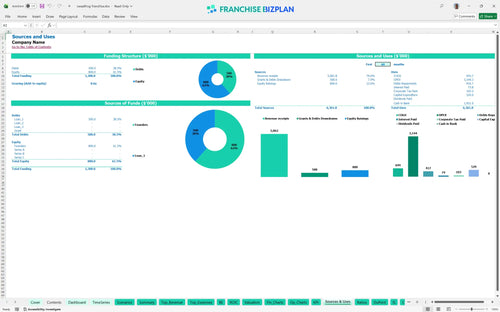
Launching this unit requires significant capital expenditure forecasting, primarily for the $220,000 in leasehold improvements and $120,000 for specialized yogurt machines. This budgeting template for food and beverage franchise launch identifies a total investment that includes the $30,000 franchise fee and a cash buffer. Cash is king during the build-out phase.
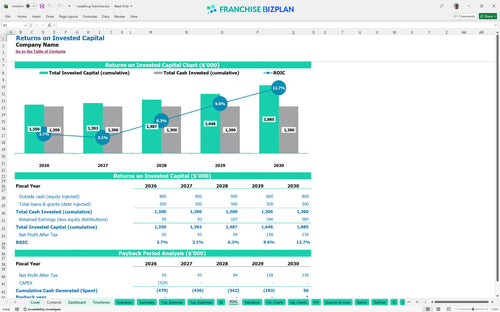
Investors can expect a 5-year payback period with an Internal Rate of Return (IRR) of 2.32% and a Return on Equity (ROE) of 0.73. This ROI calculation for franchises shows that while initial returns are conservative, the average net margin improves as annual EBITDA grows. Calculating ROI for local franchise business opportunities is easier when you track these essential financial metrics for new franchise owners.
The unit reaches break-even in 4 months, provided you hit the volume targets for self-serve sales and catering. Planning operational costs for a dessert franchise unit is critical because the $12,000 monthly rent demands high throughput to offset fixed occupancy costs. Volume is the only cure for high rent in a prime location.
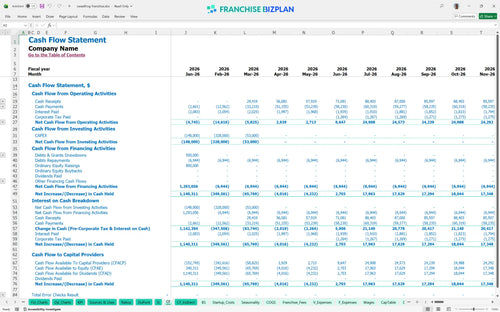
The lowest cash point occurs in May 2026 at $717,000, meaning you need a solid capital cushion before the summer peak. This franchise unit cash flow analysis spreadsheet ensures you have enough runway to handle the gap between construction draws and mature sales volume. Having a cash buffer is defintely recommended to handle any delays in the March launch date.
Evaluating dessert business investment risk involves toggling between Low, Medium, and High cases to see how traffic affects your $181,000 Year 1 EBITDA. A High case driven by strong local marketing can push Year 5 revenue to $1,309,000 and EBITDA to $394,000. Success depends on your local execution and community partnerships.
Finance: update unit break-even and payback model by Friday.
This frozen yogurt franchise financial model is built in Excel with open formulas, letting you swap out assumptions for your specific territory. You can adjust everything from seasonal traffic dips to local labor rates without breaking the logic. Every 1-point margin leak matters fast in a single-unit model.

Map out your long-term path from grand opening to a mature multi-unit operation using this franchise unit business plan Excel. This tool tracks five years of revenue, cash flow, and tax implications so you can see when your dessert shop actually starts paying you back. These frozen yogurt shop financial projections help you visualize the climb from Year 1 to Year 5.

Don't let the 5% royalty and 2.5% marketing fund catch you off guard. The model bakes these franchise royalty fees directly into your monthly P&L to show exactly how much cash stays in your pocket. Understanding your franchise unit economics is the only way to ensure your local overhead doesn't swallow your margins.

Launching a froyo shop requires significant upfront capital for machines and leaseholds. This froyo franchise profitability analysis identifies your total investment and the exact monthly sales volume needed to stop burning cash. Use this franchise startup cost template to learn how to calculate startup costs for a frozen yogurt franchise before signing your lease.

We've included standard operating expenses for food service so you can check if your $12,000 monthly rent or 11.2% yogurt base cost is realistic. Comparing your projections to industry norms helps you spot red flags before you sign a lease. A single-unit operator must be a trend-aware realist to survive the first year.


Simply purchase and download the financial model template, then access it instantly using Microsoft Excel or Google Sheets. No installation or technical expertise required-just open and start working.

Enter your business-specific numbers, including revenue projections, costs, and investment details. The pre-built formulas will automatically calculate financial insights, saving you time and effort.

Leverage the investor-ready format to confidently showcase your financial projections to banks, franchise representatives, or investors. Impress stakeholders with clear, data-driven insights and professional reports.

Leverage the investor-ready format to confidently present your projections to banks, franchise representatives, or investors.