
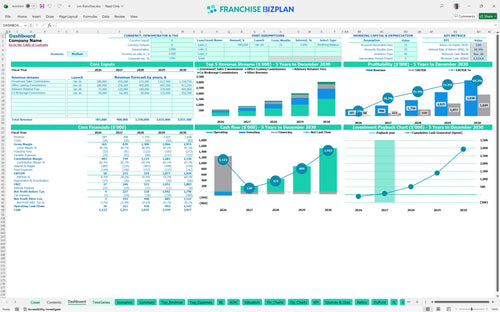
All-in-one Dashboard
Core inputs and core outputs


This franchise unit economics spreadsheet provides a professional-grade pro forma financial statements for commercial brokerage business, covering everything from initial CAPEX to five-year EBITDA growth.
Core inputs and core outputs
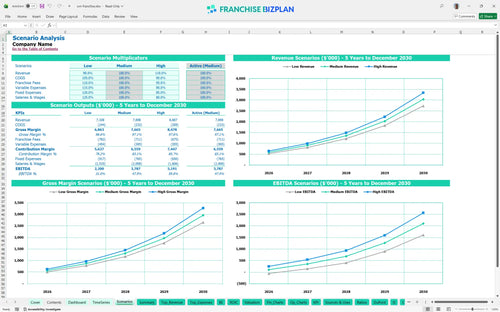
Three scenario analysis
Presentation ready
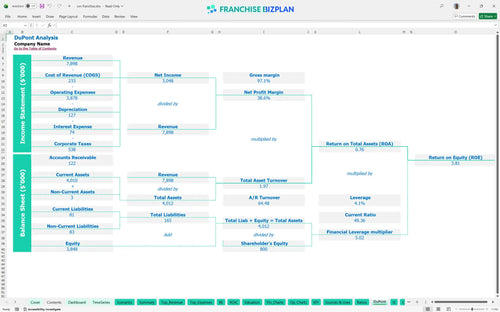
DuPont analysis
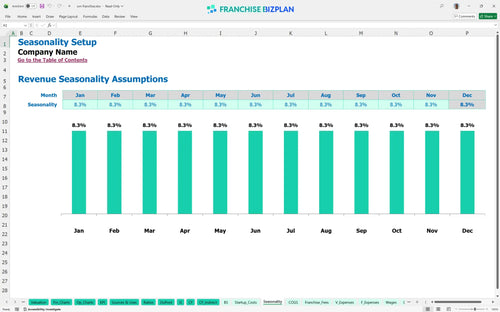
Researched revenue assumptions
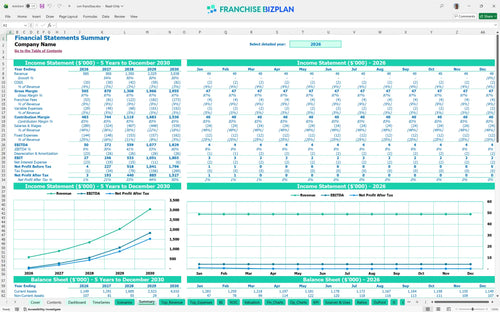
Lender-friendly financial outputs
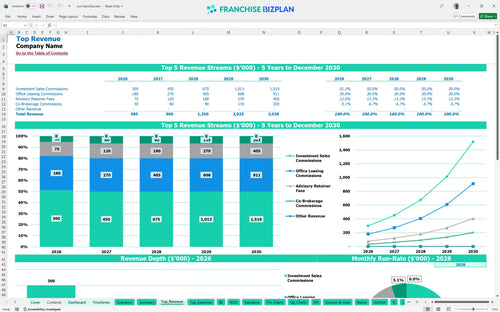
Revenue stream detailed view
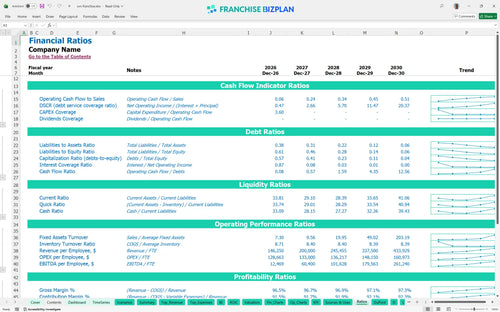
Performance metrics benchmark
We built this financial forecasting tool for new real estate brokerage offices using detailed research into the mid-market tech corridor. The model includes pre-filled data like the $31,800 franchise fee and specific commission tiers, but you can defintely tweak them to fit your specific territory. With a projected Year 1 EBITDA of $50,000, the numbers show a lean but profitable start for a new operator.
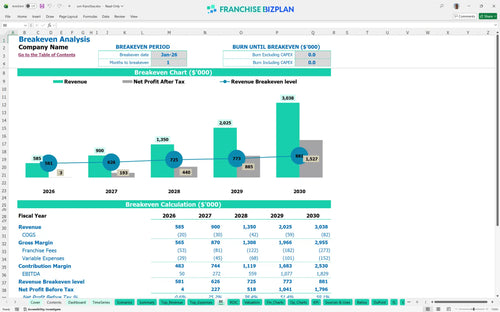
This unit hits profitability almost immediately, with a breakeven date of January 2026. By Year 3, EBITDA jumps to $559,000 as Investment Sales Commissions scale to $450,000 annually, covering the 7% royalty and fixed costs like the $6,000 monthly rent.
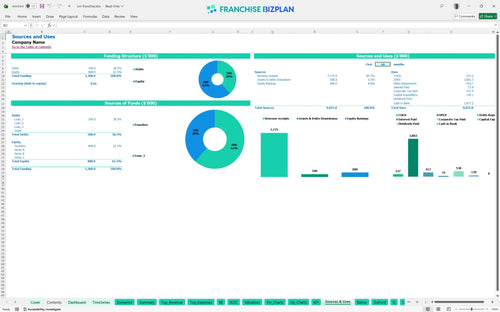
You will need approximately $130,050 in upfront capital to cover the franchise fee, office build-out, and tech stack. This estimate includes $18,000 for VR equipment and $12,000 for IT to ensure your tech-forward office is ready for day one in the tech corridor.
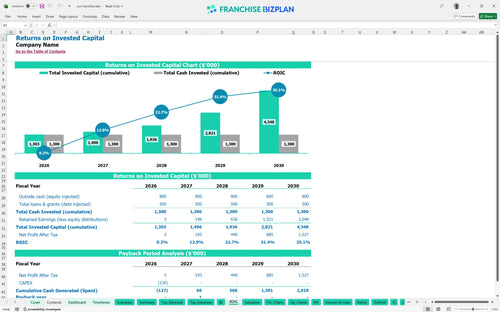
Investors can expect an IRR of 10.33% and a full payback on their initial capital within 2 years. The model shows a strong Year 5 EBITDA of $1.8 million, driven by high-margin advisory fees and scaling brokerage commissions as your team reaches full capacity.
The monthly break-even happens in month one, provided you secure your first leasing or advisory contracts quickly. The biggest lever here is your fixed overhead, specifically the $6,000 monthly rent and the $11,000 plus in initial monthly wages for your principal and administrative staff.
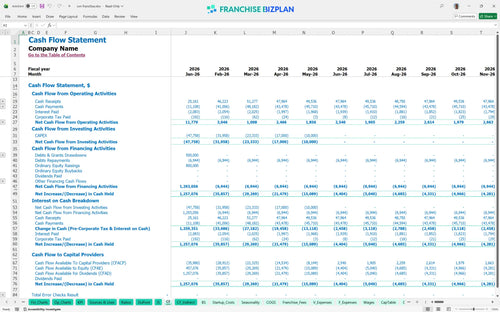
The lowest cash point occurs in December 2026, with a minimum cash balance of $1,123,000. While the model shows early profitability, you need to maintain a buffer to handle the timing gaps between closing deals and receiving commission checks from the external brokerage community.
Switching to a low-revenue scenario could push your payback period past the 2-year mark and significantly reduce your Year 1 margin. High-performance scenarios, driven by better local marketing execution and higher average tickets, could see Year 5 revenue exceed the $3 million projection.
Finance: update unit break-even and payback model by Friday
This commercial brokerage business plan lives in a flexible Excel environment where you control every variable. You can adjust commission splits, office rent, and headcounts to see how they impact your bottom line in real-time. It's built to handle the nuances of a commercial real estate franchise model without the headache of building formulas from scratch.

Scaling a brokerage requires looking past the first few closings to understand long-term unit economics. This model forecasts revenue climbing from $585,000 in year one to over $3 million by year five as your team matures. You get a clear view of how EBITDA scales once you move past the initial ramp-up phase. Still, you need to watch those commission splits closely.

Managing the 7% royalty fee structure and 2% marketing fund is vital for maintaining your store-level margin. These costs are baked into the projections, so you know exactly how much goes to the franchisor before you pay your brokers. Estimating royalty fees for commercial real estate franchise units accurately ensures your cash flow stays predictable as you scale.

Knowing how to calculate startup costs for a commercial real estate franchise is the first step to avoiding a cash crunch. With an initial investment covering everything from the $31,800 franchise fee to $18,000 in VR equipment, you need to know when the doors stay open on their own. This tool shows a fast path to stability, with breakeven hitting as early as the first month if commission timing aligns.

We've integrated CRE franchise operational expenses and margin standards to keep your projections grounded in reality. Comparing your $6,000 monthly rent or $90,000 principal salary against industry norms helps you spot where you might be overspending. It's a sanity check to ensure your commercial brokerage profit margins stay competitive in a high-demand tech corridor.


Simply purchase and download the financial model template, then access it instantly using Microsoft Excel or Google Sheets. No installation or technical expertise required-just open and start working.

Enter your business-specific numbers, including revenue projections, costs, and investment details. The pre-built formulas will automatically calculate financial insights, saving you time and effort.

Leverage the investor-ready format to confidently showcase your financial projections to banks, franchise representatives, or investors. Impress stakeholders with clear, data-driven insights and professional reports.

Leverage the investor-ready format to confidently present your projections to banks, franchise representatives, or investors.