
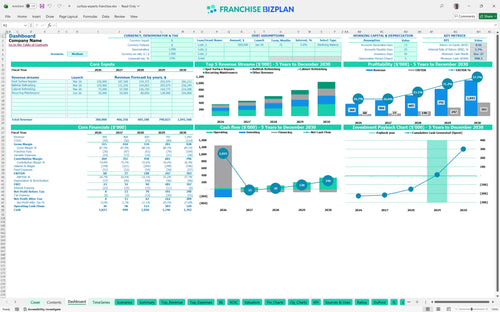
All-in-one Dashboard
Core inputs and core outputs


This franchise unit financial performance model provides a complete Excel-based toolkit for forecasting revenue, expenses, and cash flow for a mobile surface restoration business.
Core inputs and core outputs
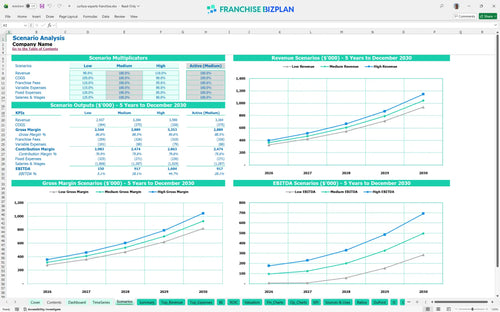
Three scenario analysis
Presentation ready
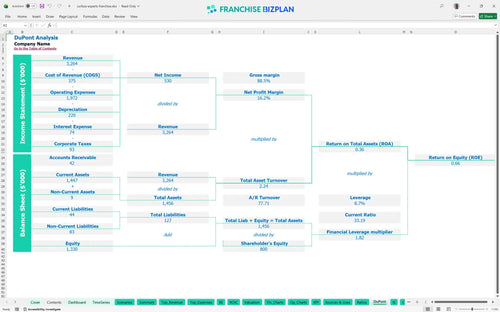
DuPont analysis
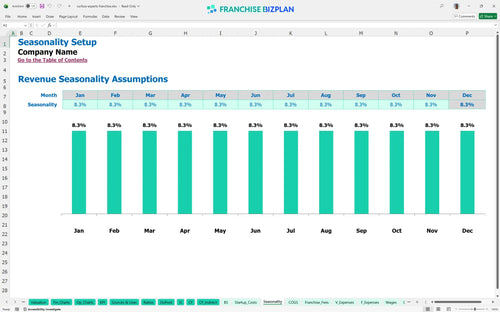
Researched revenue assumptions
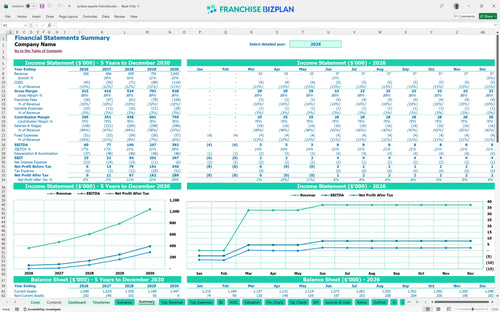
Lender-friendly financial outputs
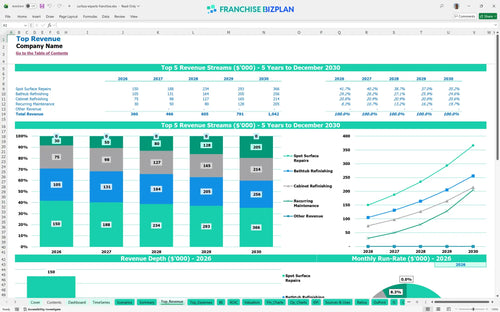
Revenue stream detailed view
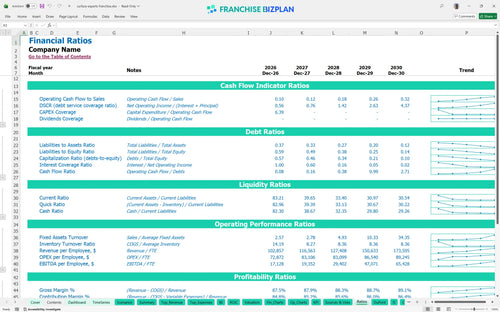
Performance metrics benchmark
We built this franchise unit financial model using our own research into the surface restoration sector. Key assumptions like the 8% royalty and the $2,200 monthly warehouse lease are pre-populated and fully editable to match your specific territory. With a projected Year 1 EBITDA of $60,000 and Year 5 revenue reaching $1,042,000, this model helps you visualize the path from startup to a mature, multi-van operation.
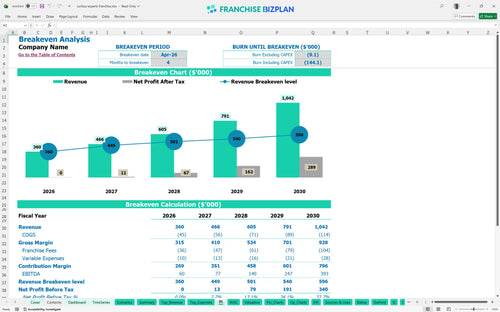
Based on the data, this unit hits its stride quickly, reaching a monthly break-even point just four months after launch in April 2026. By Year 3, EBITDA is expected to climb to $140,000 as recurring maintenance contracts and cabinet refinishing revenue scale up. Determining profitability of a restoration business depends on keeping your service technicians productive and managing that 10% combined royalty and marketing load. Profit isn't an accident; it's a scheduled event.
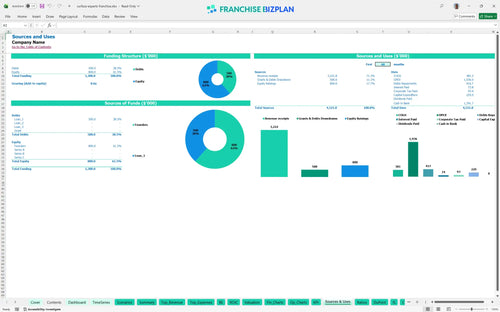
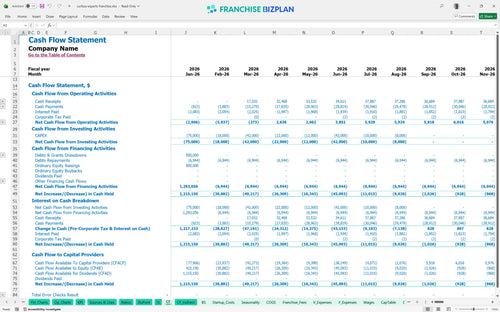
You will need a solid capital base to cover the $75,000 franchise fee and the initial $42,000 for your first service van. The total investment also covers office setup, equipment tools, and an initial inventory of repair materials. We recommend having a cash buffer, as the model shows a minimum cash point of $998,000 in December 2027, which includes your accumulated operating capital. You can't fix surfaces if you can't fund the fleet.
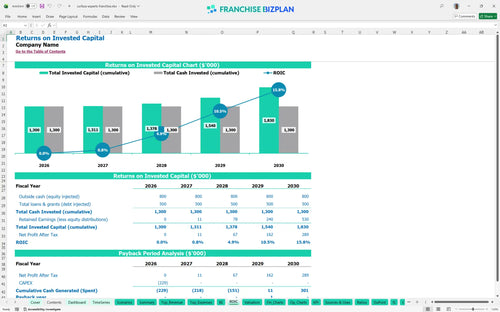
The model shows an Internal Rate of Return (IRR) of 3.31% and a Return on Equity (ROE) of 0.66 over the five-year period. While the IRR seems conservative, the business generates significant cash flow by Year 5, with EBITDA hitting $393,000. You are looking at a 4-year payback period to recoup your initial investment into the fleet and franchise rights. Patience is a financial virtue in the restoration game.
The unit is projected to break even in April 2026, just four months after the January 2026 start. This rapid ramp-up is driven by the low fixed overhead of a $2,200 monthly lease and a lean initial staff. Your biggest variable hurdle will be the labor cost for technicians, which scales as you move from one to three full-time employees. Speed to break-even is the best stress reliever for a new owner.
Your cash runway is protected by the relatively low monthly fixed costs of about $4,250 before labor. The lowest cash point in our model occurs late in the projection, but that is largely due to how we have modeled reinvestment and growth. To keep things safe, you should monitor the timing between finishing a job and receiving payment from property managers. Cash is the oxygen of your mobile operation.
In a high-growth scenario where B2B demand from luxury apartments peaks early, Year 1 margins can exceed the projected 16% EBITDA margin. Conversely, a low scenario-perhaps due to slower technician hiring-could delay your 4-year payback. Estimating operating expenses for a new franchise accurately is the difference between a smooth ramp-up and a constant cash crunch. Plan for the best, but build the model for the worst.
Finance: update unit break-even and payback model by Friday
This franchise financial model template is fully editable in Excel, allowing you to swap out our researched assumptions for your specific territory data. We have pre-loaded the formulas so you can tweak revenue drivers or labor costs without breaking the sheet. It is built to handle everything from a single van to a multi-unit fleet. It's your business; don't let a locked spreadsheet tell you how to run it.

Planning for a mobile service business requires looking past the first few months of 'repair over replacement' jobs. This model delivers a 5-year outlook on cash flow and franchise profitability analysis, mapping how your margins shift as you add more technicians. With revenue projected to grow from $360,000 in year one to over $1 million by year five, you need to see the impact on your bottom line. Growth is great, but cash flow is what keeps the vans running.

Every dollar counts when you are paying an 8% royalty and a 2% marketing fee. This tool calculates these ongoing obligations automatically based on your monthly sales of spot repairs and refinishing. It ensures you know exactly how much goes to the franchisor before you cover your own rent and payroll. Honestly, tracking these 'off-the-top' costs is the only way to protect your franchise unit economics. Royalties are the price of the brand, so make sure the brand is working for you.

Use our franchise startup cost calculator to estimate the total check you need to write before the first van hits the road. We have included the $75,000 franchise fee, equipment, and initial inventory to help you find your break-even analysis. Knowing you need to hit break-even by April 2026 helps you manage your initial cash runway more effectively. Knowing your number is the first step to sleeping better at night.

We defintely didn't pull these numbers out of thin air; they are based on restoration industry standards for labor and materials. The model includes benchmarks for repair materials-starting around 11.2% of sales-so you can see if your costs are out of whack. Comparing your projected gross margins against these targets in your franchise investment feasibility study template keeps your business plan grounded in reality. Benchmarks are the guardrails that keep your ego from driving the bus.


Simply purchase and download the financial model template, then access it instantly using Microsoft Excel or Google Sheets. No installation or technical expertise required-just open and start working.

Enter your business-specific numbers, including revenue projections, costs, and investment details. The pre-built formulas will automatically calculate financial insights, saving you time and effort.

Leverage the investor-ready format to confidently showcase your financial projections to banks, franchise representatives, or investors. Impress stakeholders with clear, data-driven insights and professional reports.

Leverage the investor-ready format to confidently present your projections to banks, franchise representatives, or investors.