
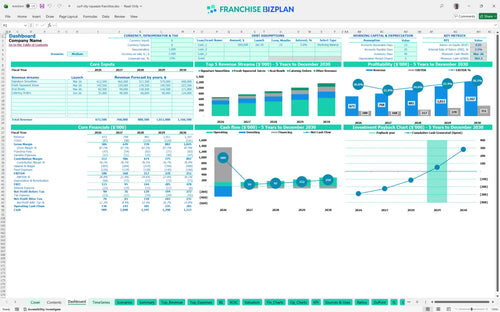
All-in-one Dashboard
Core inputs and core outputs


This Excel template for franchise investment analysis provides a complete roadmap from initial build-out to a mature five-year operating state.
Core inputs and core outputs
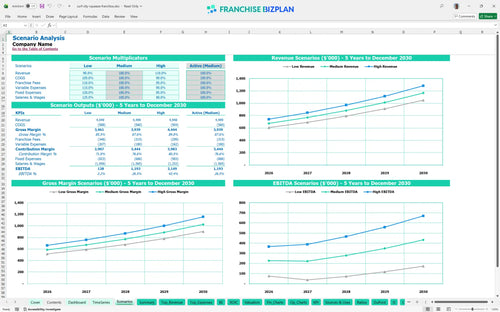
Three scenario analysis
Presentation ready
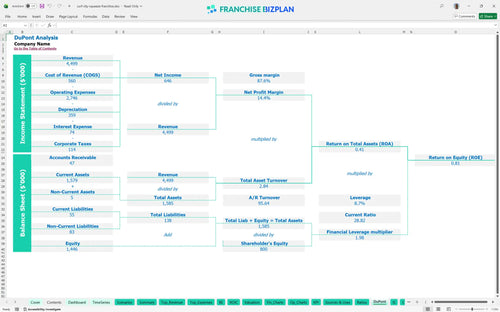
DuPont analysis
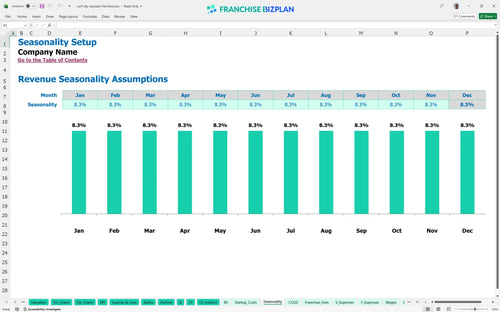
Researched revenue assumptions
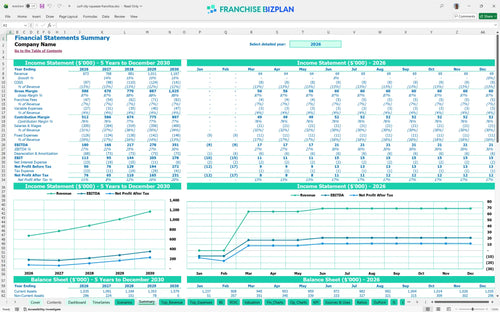
Lender-friendly financial outputs
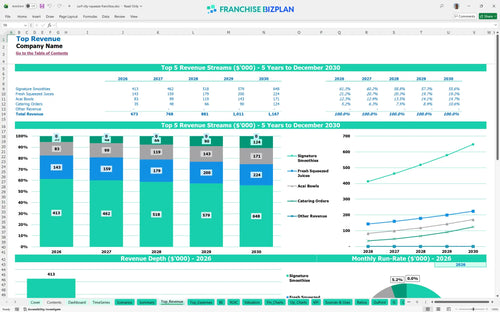
Revenue stream detailed view
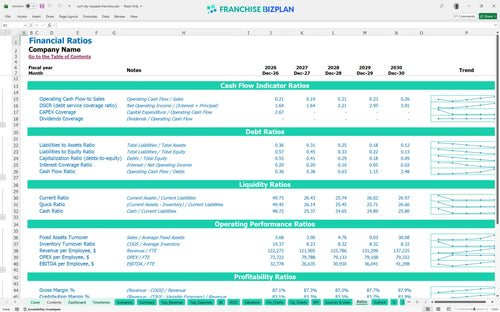
Performance metrics benchmark
We built this franchise unit financial model using our own research to reflect the actual unit economics of a high-traffic smoothie location. Key assumptions like the $30,000 franchise fee, 6% royalty, and 5-year revenue growth from $673,000 to $1,167,000 are pre-populated and fully editable to match your specific site selection and local demand.
The franchise unit profitability analysis shows the store reaching breakeven in March 2026, just three months after opening. By year five, the unit is projected to generate $351,000 in EBITDA (earnings before interest, taxes, depreciation, and amortization) as catering and high-margin acai bowls become a larger part of the mix.
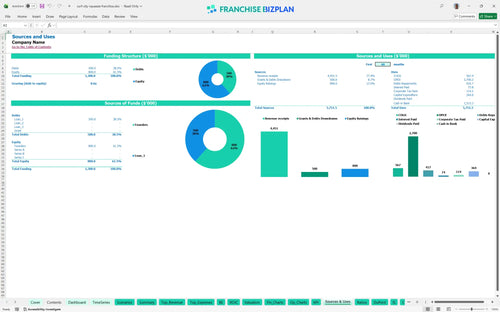
Launching this unit in the US requires a total initial investment of approximately $364,000, which includes the $30,000 franchise fee and $160,000 for leasehold improvements. This startup budget template for small business franchise also accounts for $90,000 in specialized blending equipment and a $902,000 minimum cash position to handle the initial ramp-up phase.
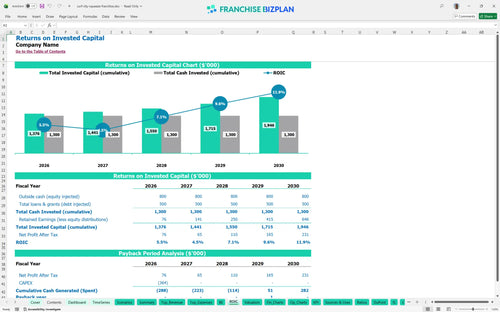
The ROI analysis for franchise indicates a 4-year payback period and an internal rate of return (IRR) of 3.5%. While the IRR is conservative, the return on equity (ROE) of 0.81 suggests the business is defintely generating value relative to the initial cash outlay as revenue climbs toward $1.1 million.
Estimating profitability for a new franchise location requires covering $11,630 in monthly fixed costs, including the $7,500 prime location rent. You reach the monthly break-even point in March 2026, provided you maintain high throughput (speed of service) during peak morning and weekend hours near high-traffic parks.
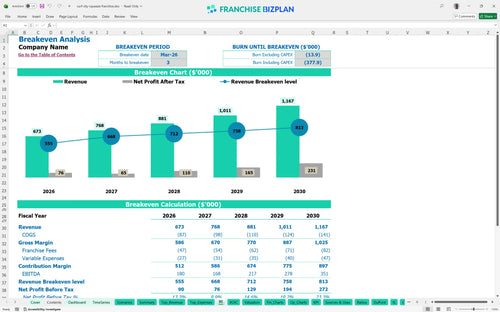
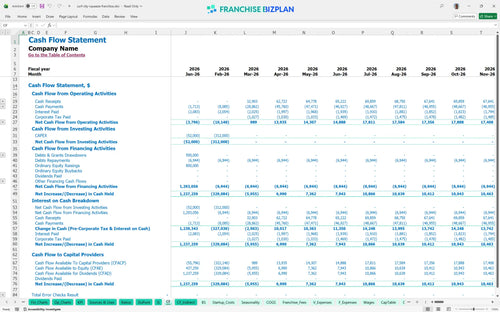
The franchise unit cash flow forecasting spreadsheet identifies March 2026 as the lowest cash point during the ramp-up. You need enough runway to handle the $11,630 in monthly fixed expenses before the revenue from signature smoothies and fresh juices fully stabilizes your bank balance.
Comparing scenarios shows that a high-performance case driven by strong catering and mobile ordering can significantly pull forward the 4-year payback period. Conversely, a low-revenue scenario would increase the peak cash need and require tighter management of the $11,630 monthly fixed expense load to protect year-1 margins.
This franchise unit financial model template provides a fully customizable Excel environment to stress-test your assumptions before signing a lease. You can adjust pre-filled formulas for local labor rates, specific rent costs, and product pricing to ensure the retail franchise financial projections align with your specific territory and market conditions.

Multi-unit growth requires looking past the grand opening to see how the business scales over several years. This model delivers detailed 5-year revenue forecasts, showing growth from $673,000 in year one to over $1.16 million by year five, helping you plan for future capital needs and expansion timing.

Calculating franchise royalty and marketing fees accurately is the only way to protect your store-level margin from unexpected leaks. The model automatically tracks the 6% royalty and 1% marketing fund contributions against your monthly sales, so you always know exactly how much is being paid to the franchisor before you calculate your take-home pay.

Knowing how to calculate startup costs for a smoothie franchise prevents mid-build-out cash crunches and ensures you have enough runway. This break-even point calculator uses your $364,000 initial investment to determine the exact sales volume needed to cover your $7,500 monthly rent and other fixed overhead.

This food and beverage franchise financial planning guide incorporates industry-standard benchmarks to help you sanity-check your operating costs. If your food ingredients are running at the projected 11%, you are in a strong position, but the model helps you identify if labor or packaging costs are drifting outside of healthy ranges.


Simply purchase and download the financial model template, then access it instantly using Microsoft Excel or Google Sheets. No installation or technical expertise required-just open and start working.

Enter your business-specific numbers, including revenue projections, costs, and investment details. The pre-built formulas will automatically calculate financial insights, saving you time and effort.

Leverage the investor-ready format to confidently showcase your financial projections to banks, franchise representatives, or investors. Impress stakeholders with clear, data-driven insights and professional reports.

Leverage the investor-ready format to confidently present your projections to banks, franchise representatives, or investors.