
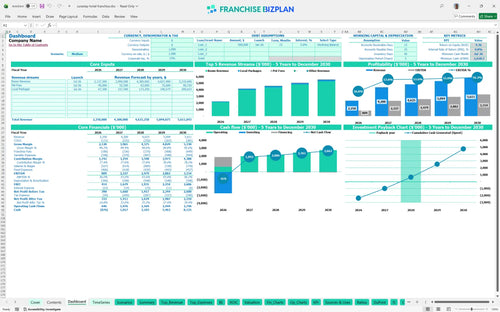
All-in-one Dashboard
Core inputs and core outputs


This hotel franchise financial model includes detailed tabs for revenue forecasting, payroll planning, and capital expenditure tracking to give you a complete picture of your investment.
Core inputs and core outputs
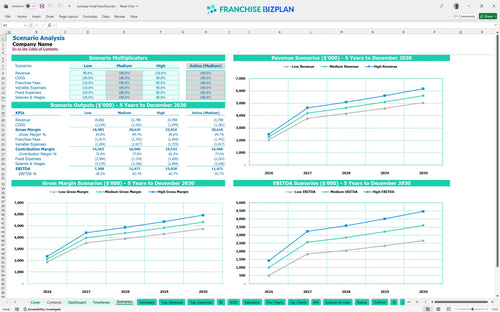
Three scenario analysis
Presentation ready
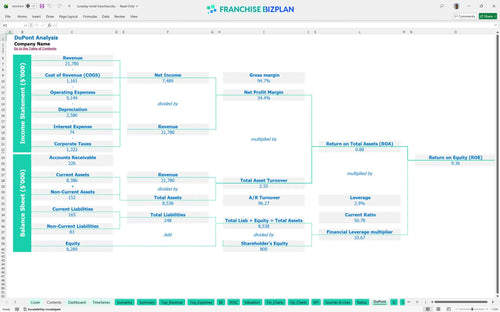
DuPont analysis
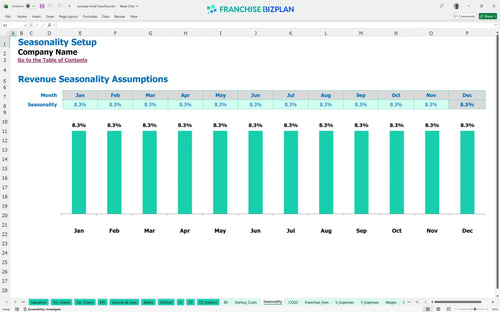
Researched revenue assumptions
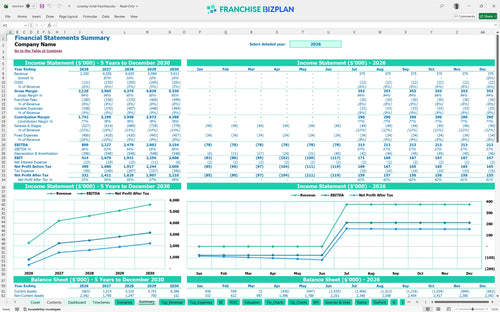
Lender-friendly financial outputs
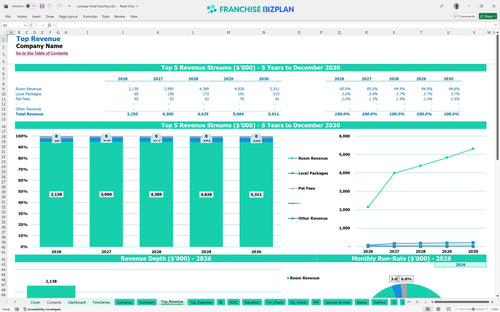
Revenue stream detailed view
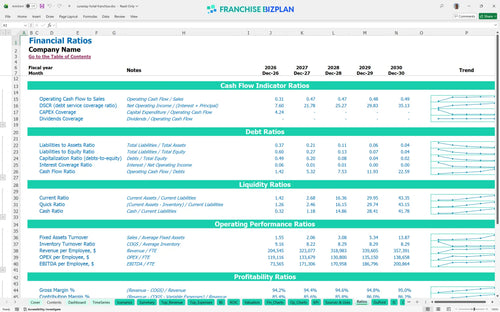
Performance metrics benchmark
We built this hotel franchise financial model using our own research to help you evaluate the economy lodging sector. Key assumptions like the $2.25 million Year 1 revenue and 4% royalty fees are pre-populated and fully editable to match your specific location. This tool defintely helps you track how pet fees and local packages impact your bottom line.
This hotel unit reaches profitability quickly, showing an EBITDA (earnings before interest, taxes, depreciation, and amortization) of $809,000 in its first year. By Year 2, earnings scale to $2.2 million as revenue nearly doubles, even after accounting for the 8% combined royalty and marketing fee burden. Every point of margin counts when you are scaling from $2.2 million to $5.6 million.
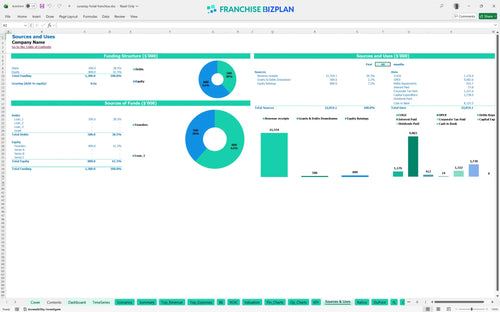
You need significant capital to get this unit off the ground, with $1.8 million dedicated to leasehold improvements alone. The total startup cost includes the $38,000 franchise fee and $650,000 for FF&E (furniture, fixtures, and equipment), creating a high entry barrier. Build-out costs are your biggest hurdle before the first guest checks in.
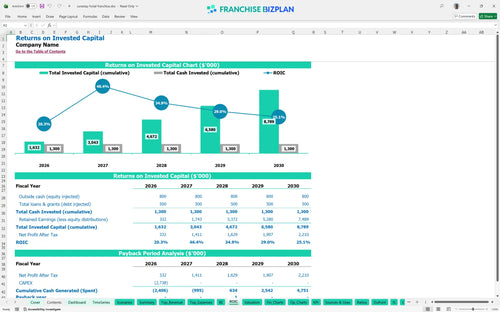
Investors can expect a 4.79% IRR (internal rate of return) and a 9.36% ROE (return on equity) over the five-year hold. The model projects a 3-year payback period, which is competitive for a branded economy hotel with these build-out costs. A three-year payback is a solid target for a high-CAPEX (capital expenditure) hotel play.
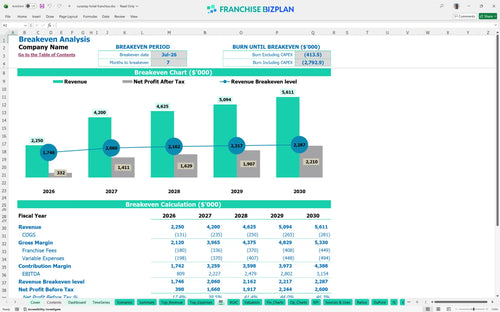
The unit hits its monthly break-even point in July 2026, just 7 months after the project starts. This timing depends heavily on hitting your $1.4 million room revenue target in the first half-year while managing the $20,000 monthly rent. Seven months to break even is fast, but it requires hitting your ADR (average daily rate) targets early.
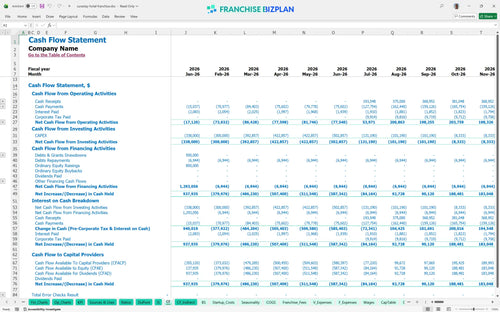
The lowest cash point is -$1,619,000 in July 2026, marking the end of the heavy construction and setup phase. You must ensure your financing covers this valley before the $4.2 million Year 2 revenue provides a safety net. Cash is tightest right at the transition from construction to operations.
Creating a financial forecast for a new franchise location requires looking at the best and worst cases. This financial feasibility study for hotel franchise investors shows that while Year 1 revenue starts at $2.25 million, a high-growth scenario can push Year 5 to $5.6 million. The model tracks how these shifts change your 4.79% IRR and peak cash needs. The high-growth scenario relies heavily on those $60,480 pet fees by year five.
Finance: update unit break-even and payback model by Friday.
This franchise startup cost template is built in Excel with open formulas so you can tweak every assumption. It is a financial model template for economy hotel owners that lets you swap out local tax rates or utility costs without breaking the logic. You can use it to test different staffing levels or room rates to see how they impact your bottom line.

Use this hotel business plan spreadsheet to map out your growth over sixty months. It provides a hotel franchise profitability projection spreadsheet that tracks how your margins evolve as you move from the initial ramp-up to a mature operating state. The model handles everything from Year 1 debt service to Year 5 exit valuations.

This franchise investment analysis tool simplifies your franchise royalty fee calculation by automating the 4% royalty and 4% marketing fund payments. It helps you see exactly how much cash stays in the unit after the brand takes its cut. You can also model the $38,000 initial fee to see how it affects your day-one liquidity.

Building a hotel operational expense budget requires precision, especially when estimating operating expenses for a branded hotel unit. This model identifies your fixed costs like the $20,000 monthly rent and variable costs like the 7.5% OTA (online travel agency) commissions. It shows you exactly what occupancy level you need to stop burning cash and start generating profit.

We include best practices for hotel franchise financial planning by integrating standard benchmarks for the economy segment. You can compare your guest amenity supplies (starting at 3.5%) or revenue per available room analysis against typical industry averages. This helps you spot if your labor costs or linen expenses are drifting too far from the norm.


Simply purchase and download the financial model template, then access it instantly using Microsoft Excel or Google Sheets. No installation or technical expertise required-just open and start working.

Enter your business-specific numbers, including revenue projections, costs, and investment details. The pre-built formulas will automatically calculate financial insights, saving you time and effort.

Leverage the investor-ready format to confidently showcase your financial projections to banks, franchise representatives, or investors. Impress stakeholders with clear, data-driven insights and professional reports.

Leverage the investor-ready format to confidently present your projections to banks, franchise representatives, or investors.