
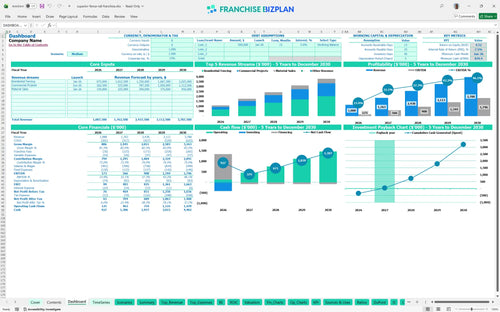
All-in-one Dashboard
Core inputs and core outputs


This Excel template for franchise unit financial forecasting provides a data-driven roadmap to manage your investment from day one through year five.
Core inputs and core outputs
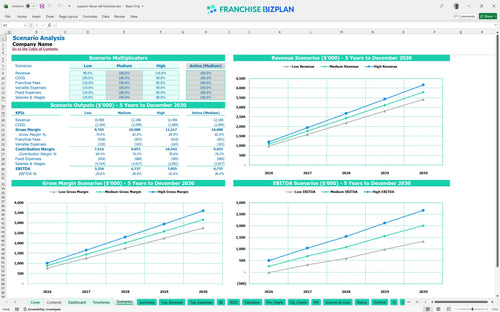
Three scenario analysis
Presentation ready
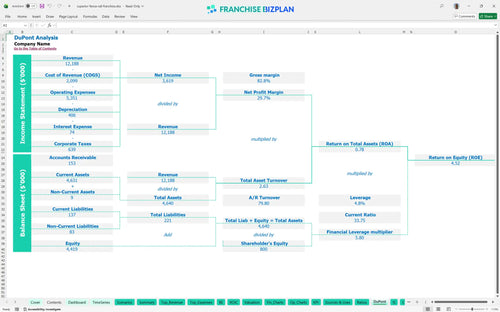
DuPont analysis
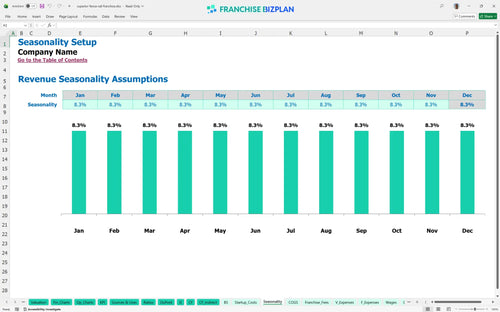
Researched revenue assumptions
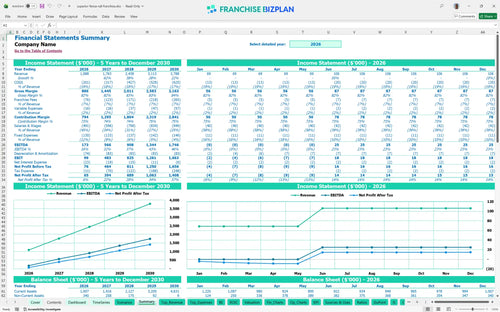
Lender-friendly financial outputs
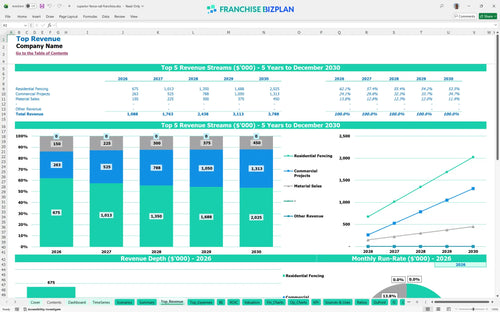
Revenue stream detailed view
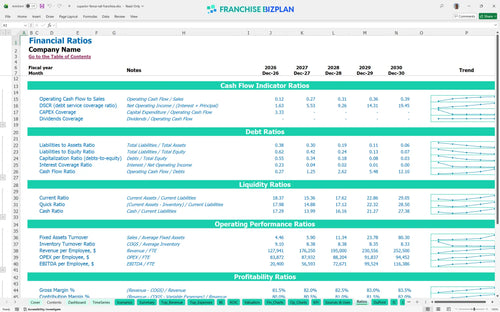
Performance metrics benchmark
We built this franchise unit financial model using our own research to help with financial planning for new franchise owners. Key assumptions like the $59,500 franchise fee and $120,000 truck investment are pre-populated with researched data specific to this business model for franchise and are fully editable. The model shows a clear path from a $173,000 year-one EBITDA to over $1.7M by year five.
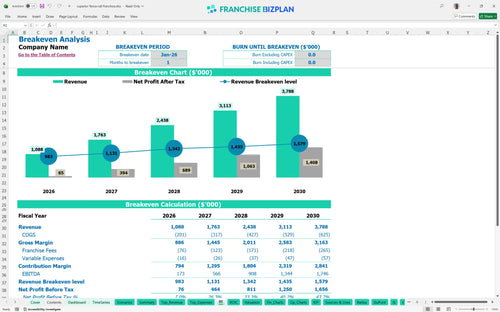
Profitability starts almost immediately, with the model showing a break-even date in January 2026. By year two, EBITDA jumps to $566,000 as residential and commercial projects scale. This franchise profitability analysis accounts for the 7% total franchise fees and rising labor costs.
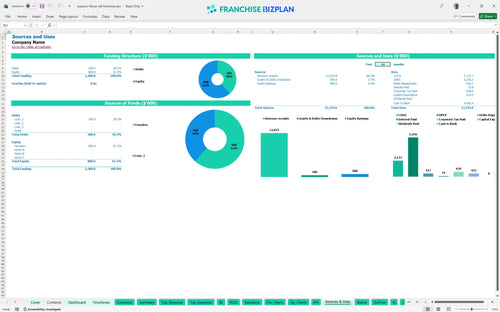
You will need approximately $414,500 to launch this unit in the US market. This capital expenditure planning covers the initial franchise fee, warehouse improvements, and a significant fleet of installation trucks. This model tracks every dollar from the $59,500 franchise fee to the last office chair.
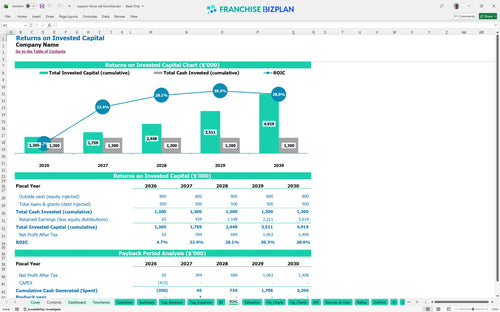
The franchise investment ROI spreadsheet projects an Internal Rate of Return (IRR) of 7.49% and a Return on Equity (ROE) of 4.52%. While the initial returns are steady, the real value is in the 2-year payback period. Honestly, the ROI calculation looks much better once the unit reaches full capacity in year three.
Analyzing break-even point for small business franchises shows this unit hits the mark in month 1. The main driver is the high average ticket for residential fencing which covers operational overhead costs quickly. High average tickets are your best friend in this model.
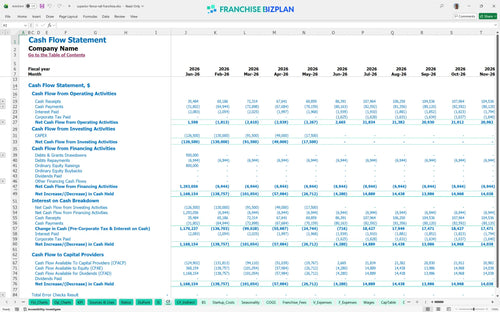
The lowest cash point occurs in June 2026, with a minimum cash balance of $839,000. This suggests a healthy buffer is maintained, but you defintely need to watch the timing of truck purchases and inventory stocking. Cash is king, but timing is the queen.
Estimating profit margins for a service-based franchise requires looking at Low, Medium, and High cases. A 10% drop in revenue can delay payback, while the High case sees year-5 revenue exceeding $3.7M. Scenarios help you plan for the worst while aiming for the best.
Finance: update unit break-even and payback model by Friday.
This franchise financial model template is built in Excel, allowing you to tweak every assumption to fit your specific territory. You can adjust local labor rates or material costs without breaking the logic. How to build a pro forma for a franchise unit becomes simple when the math is already done for you. It's a flexible tool designed for real-world testing.

Planning for a single unit or a small franchise chain requires a long-term view of cash flow. This franchise financial projection tool provides a detailed 5-year outlook, mapping out how revenue scales from $1.08M to over $3.7M. Best practices for franchise unit budget planning suggest looking at least sixty months ahead. It helps you see the forest and the trees.

A franchise royalty and fee structure analysis is vital for understanding your true take-home pay. This model automatically calculates the 6% royalty and 1% marketing fund against your projected sales based on a franchise disclosure document analysis. It ensures you don't overlook the cost of brand support. It ensures you don't overlook the cost of brand support.

Knowing how to calculate startup costs for a franchise is the first step to avoiding a cash crunch. This franchise startup costs spreadsheet breaks down the $414,500 initial investment, including trucks and warehouse improvements. It identifies the exact point where your monthly revenue covers every fixed cost. It identifies the exact point where your monthly revenue covers every fixed cost.

We've included benchmarks for evaluating profitability of home service franchise units so you aren't flying blind. Compare your unit economics-like material costs starting around 16%-against industry norms to ensure your margins stay competitive. It's a sanity check for your business plan. It's a sanity check for your business plan.


Simply purchase and download the financial model template, then access it instantly using Microsoft Excel or Google Sheets. No installation or technical expertise required-just open and start working.

Enter your business-specific numbers, including revenue projections, costs, and investment details. The pre-built formulas will automatically calculate financial insights, saving you time and effort.

Leverage the investor-ready format to confidently showcase your financial projections to banks, franchise representatives, or investors. Impress stakeholders with clear, data-driven insights and professional reports.

Leverage the investor-ready format to confidently present your projections to banks, franchise representatives, or investors.