
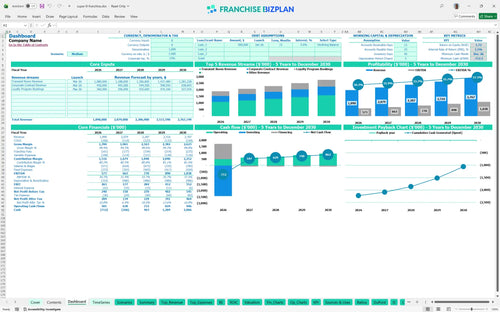
All-in-one Dashboard
Core inputs and core outputs


This franchise unit financial model template provides a comprehensive toolkit for analyzing the performance and capital needs of a roadside economy lodging asset.
Core inputs and core outputs
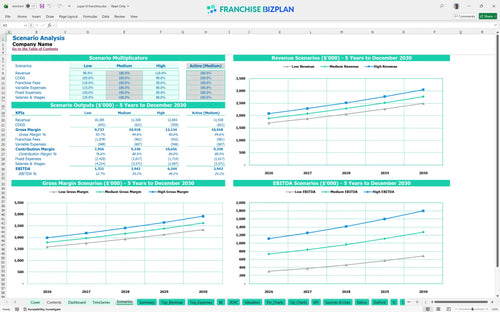
Three scenario analysis
Presentation ready
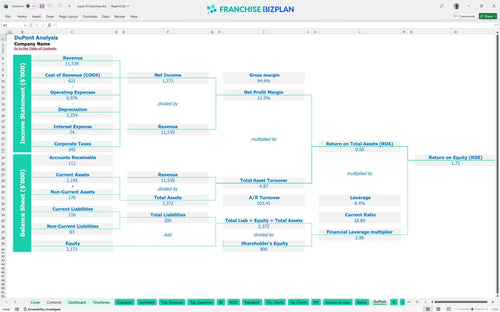
DuPont analysis
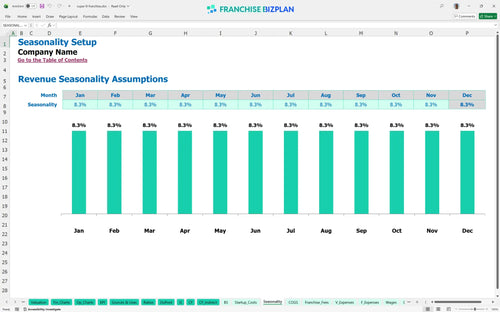
Researched revenue assumptions
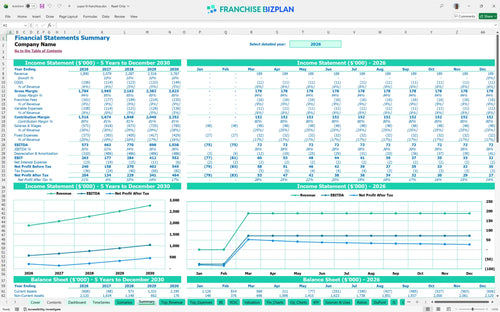
Lender-friendly financial outputs
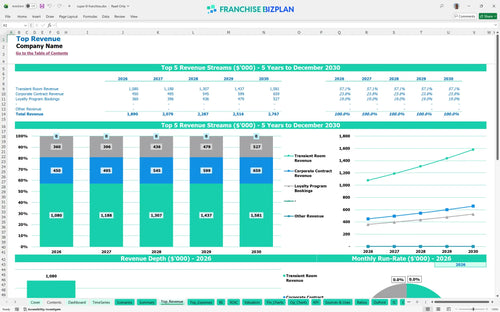
Revenue stream detailed view
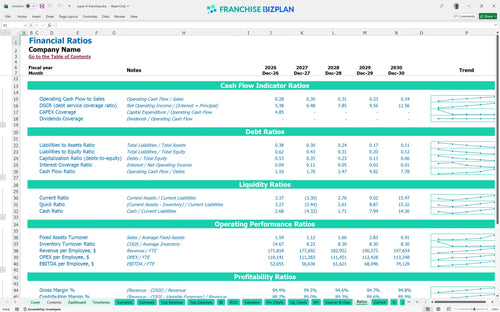
Performance metrics benchmark
We built this franchise unit financial model using our own research to ensure it reflects the realities of the economy lodging sector. Key assumptions, including transient room revenue starting at $720,000 and EBITDA scaling from $573,000 to over $1 million, are pre-populated and fully editable. This tool helps you track everything from the $200,000 HVAC system investment to the 8.5% total brand fee burden.
The unit reaches operational profitability very quickly, with a breakeven date of April 2026, just four months after launch. According to the hotel franchise unit profitability analysis guide, the hospitality profit and loss statement shows a year-one EBITDA of $573,000, which grows steadily as you optimize distribution commissions from 3.5% down to 2.7%.
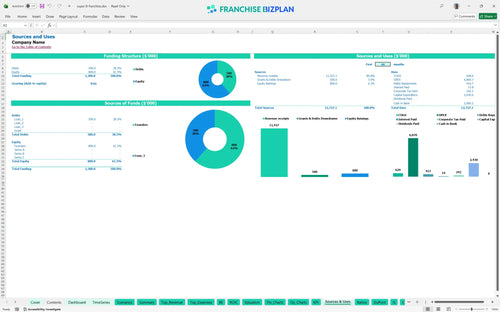
To launch this unit in the US, you need approximately $2.43 million in total capital. When learning how to calculate startup costs for a hotel franchise, you must prioritize the $1.2 million for leasehold improvements and $450,000 for guest room furnishings to meet brand standards. The model also accounts for a $25,000 franchise fee and $150,000 for front desk kiosks.
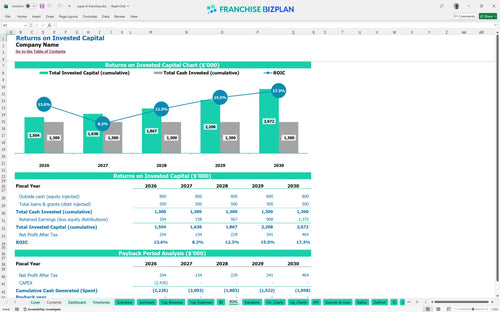
The Hotel ROI analysis indicates an Internal Rate of Return (IRR) of 1.47% and a Return on Equity (ROE) of 1.72%. While the unit generates strong annual cash flow, the significant upfront investment in property and technology means the full payback period occurs after year five. This is typical for high-CapEx lodging projects where long-term asset appreciation is a key factor.
You hit the monthly break-even point in April 2026. To reach this, you must focus on how to forecast occupancy rates for roadside lodging to cover $18,000 in monthly rent and a $318,000 annual housekeeping payroll. The primary driver for break-even speed is the ramp-up of the $720,000 transient room revenue stream during the first ten months of operation.
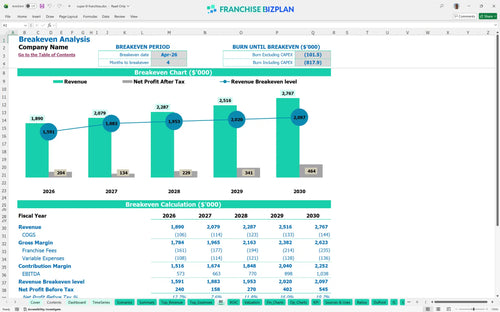
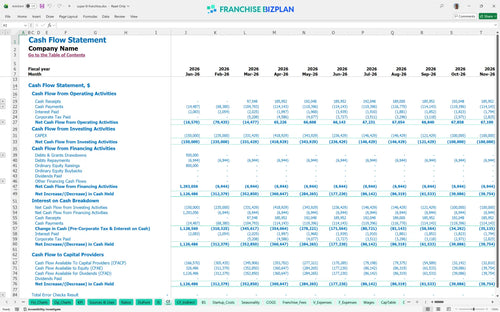
The lowest cash point occurs in December 2026 at -$712,000, suggesting you defintely need a contingency fund or a construction loan to handle the timing of leasehold payments. This cash runway analysis helps you identify the gap between the $2.4 million in outflows and the point where the $1.89 million in annual revenue stabilizes your bank balance.
Comparing Low vs. High scenarios is critical for commercial lodging revenue forecasting. While the medium case shows $1.89 million in year-one revenue, projecting revenue for highway-side hotel franchises requires testing how a 10% dip in transient bookings affects your ability to cover the $2,800 monthly property tax and $85,000 GM salary.
This franchise financial model template is a fully customizable Excel spreadsheet for franchise business financial planning. It features pre-filled formulas and editable assumptions, allowing you to adjust room rates, labor costs, and capital expenditures to fit your specific territory. This financial model template for economy hotel owners ensures you can pivot your strategy based on local Savannah market conditions without rebuilding the math from scratch.

Success in the lodging industry requires looking past the grand opening to understand long-term hospitality unit financial projections. This model provides a detailed five-year view of your economy hotel business plan, forecasting revenue growth from $1.89 million in year one to over $2.76 million by year five. It maps out the transition from the initial ramp-up phase to a mature, cash-flowing asset with a clear view of the bottom line.

Operating a branded unit involves specific financial obligations that can squeeze margins if not tracked. This franchise investment calculator simplifies estimating franchise royalty and marketing fees in Excel by applying the 5.5% royalty and 3.0% marketing fund contributions directly to your gross revenue. Understanding this franchise royalty fee structure is essential for calculating your true store-level EBITDA before you commit to the brand.

Estimating hotel franchise startup costs is the first hurdle for any investor. This model breaks down the $2.43 million initial investment, including the $25,000 franchise fee and the heavy $1.2 million lift for leasehold improvements. By analyzing fixed costs like the $18,000 monthly rent against variable room costs, you can determine the exact volume needed to move from red to black in your first year.

We have integrated operational efficiency metrics and industry benchmarks to help you sanity-check your projections. By comparing your housekeeping supply costs (starting at 3.8%) and guest amenity ratios (1.8%) against understanding economy hotel operational expense ratios, you can identify margin leaks early. This ensures your labor and occupancy costs remain within competitive ranges for the Savannah interchange corridor.


Simply purchase and download the financial model template, then access it instantly using Microsoft Excel or Google Sheets. No installation or technical expertise required-just open and start working.

Enter your business-specific numbers, including revenue projections, costs, and investment details. The pre-built formulas will automatically calculate financial insights, saving you time and effort.

Leverage the investor-ready format to confidently showcase your financial projections to banks, franchise representatives, or investors. Impress stakeholders with clear, data-driven insights and professional reports.

Leverage the investor-ready format to confidently present your projections to banks, franchise representatives, or investors.