
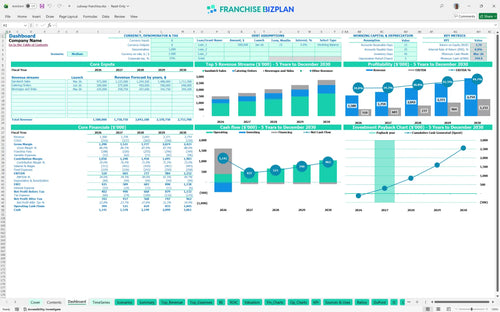
All-in-one Dashboard
Core inputs and core outputs


This comprehensive financial tool provides a data-driven roadmap for managing a high-volume food service unit from initial build-out through five years of operations.
Core inputs and core outputs
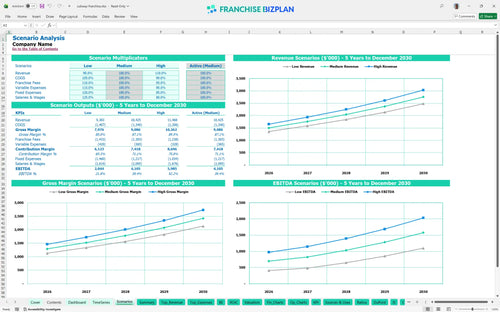
Three scenario analysis
Presentation ready
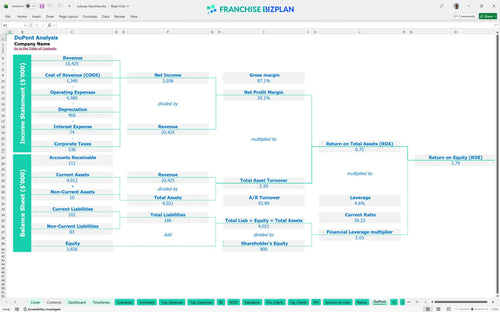
DuPont analysis
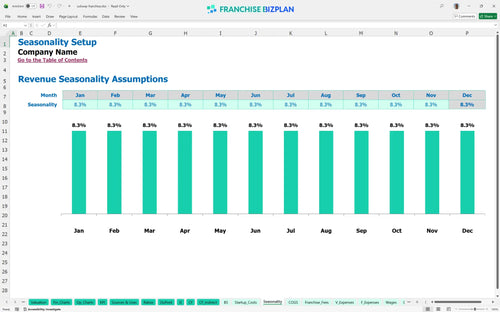
Researched revenue assumptions
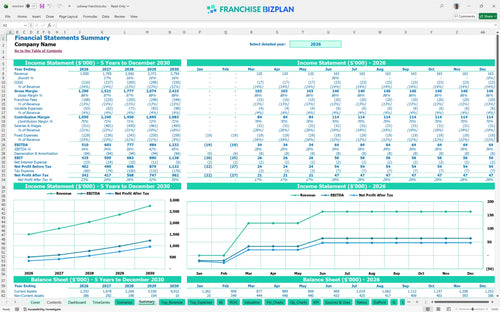
Lender-friendly financial outputs
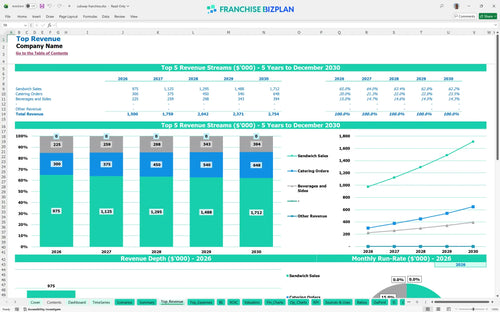
Revenue stream detailed view
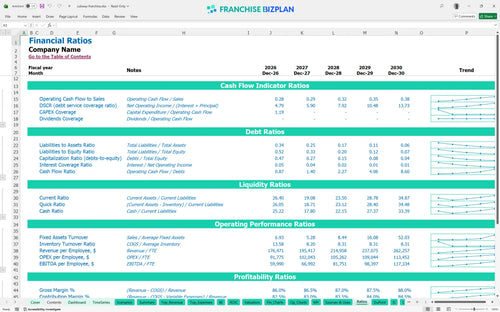
Performance metrics benchmark
We built this franchise unit financial model using our own research into high-traffic campus locations and 24-hour operational needs. Key assumptions, including the $470,000 capital expenditure and $1.5M Year 1 revenue, are pre-populated with researched data specific to this franchise unit and are fully editable. This is a practical tool for financial planning for high-traffic campus franchise locations where throughput is king.
This unit hits profitability quickly, showing a positive EBITDA of $510,000 in Year 1. After accounting for the 12.5% royalty and marketing burden plus $144,000 in annual rent, the model shows a steady climb to $1.23M in annual EBITDA by Year 5. Speed to profit is the only metric that truly settles nerves.
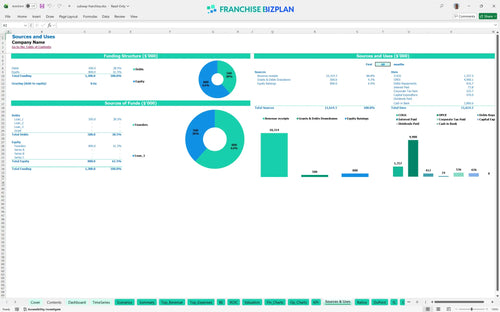
The total initial investment is approximately $470,000 to launch in a prime US campus location. This includes the $15,000 franchise fee and $220,000 for 'Fresh Forward' leasehold improvements. Every dollar spent on build-out must earn its keep.
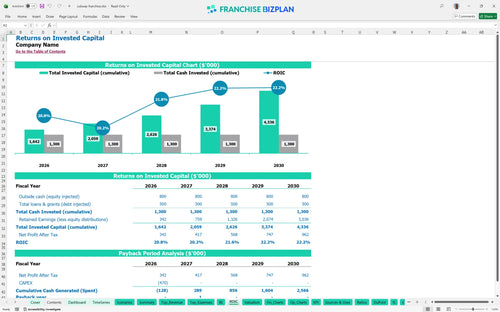
Investors can expect an Internal Rate of Return (IRR) of 8.76% and a 2-year payback period on the initial capital. This template for calculating franchise ROI and profitability shows that a franchise business model for multi-revenue stream locations provides a stable 3.79% Return on Equity. ROI is the final grade on your operational performance.
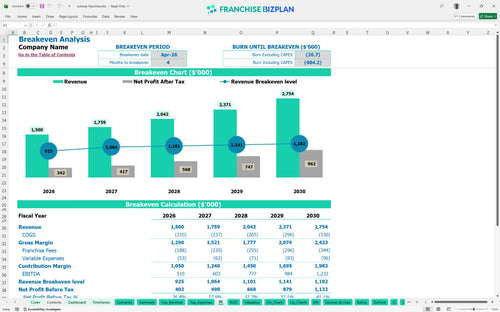
The monthly break-even point is reached in April 2026, just four months after the March launch. Reaching this milestone depends on hitting the $1.5M annual revenue target while managing high-prime rent and 24-hour labor costs. Break-even is your first major milestone; hit it fast.
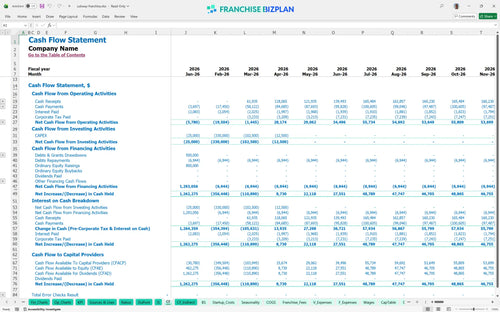
The lowest cash point is $795,000 in March 2026, meaning you need sufficient working capital to cover the initial build-out and the first month of operations. This predicting monthly cash flow for a new franchise unit suggests keeping a buffer for the 90-day ramp-up. Cash is oxygen; don't run out before you reach the summit.
The High scenario, driven by aggressive analyzing franchise profitability with catering contracts, pushes Year 5 revenue to $2.75M. Even in a Low scenario, the 24-hour model provides a floor, but your Year 1 margin of 34% EBITDA will tighten if labor isn't managed. Scenarios prepare you for the reality that plans always change.
This franchise financial model template is built in Excel with fully editable assumptions, allowing you to stress-test your quick service restaurant startup budget against real-world variables. You can easily adjust the operating expenses and revenue drivers to match your specific territory or local market conditions. Flexibility is the difference between a plan and a guess.

Our restaurant franchise business plan maps out a detailed 5-year outlook, tracking everything from initial launch to mature unit-level economics. These fast food franchise financial projections help you visualize how scaling sandwich sales and catering contracts impacts your long-term cash position. We defintely focus on the long game here. Five years is a lifetime in food service, so plan for the shift.

This model handles the heavy lifting of calculating franchise royalty fees and brand marketing fund contributions, which total 12.5% of your gross sales. By automating these calculations, you can see the impact of off-the-top costs on your monthly franchise unit profit and loss statement. Royalties are a fixed reality, not a variable suggestion.

Knowing how to calculate startup costs for a fast food franchise is critical before signing a lease. This tool provides a complete startup cost breakdown for retail food franchise units, including leasehold improvements and equipment, paired with a break-even analysis to find your safety zone. Knowing your break-even keeps the lights on during slow months.

We've integrated industry-standard benchmarks to help you sanity-check your estimating labor costs for a franchise unit and food margins. Comparing your projected performance against these guardrails ensures your franchise financial model template remains grounded in operational reality. Benchmarks keep your ego in check and your margins in line.


Simply purchase and download the financial model template, then access it instantly using Microsoft Excel or Google Sheets. No installation or technical expertise required-just open and start working.

Enter your business-specific numbers, including revenue projections, costs, and investment details. The pre-built formulas will automatically calculate financial insights, saving you time and effort.

Leverage the investor-ready format to confidently showcase your financial projections to banks, franchise representatives, or investors. Impress stakeholders with clear, data-driven insights and professional reports.

Leverage the investor-ready format to confidently present your projections to banks, franchise representatives, or investors.