
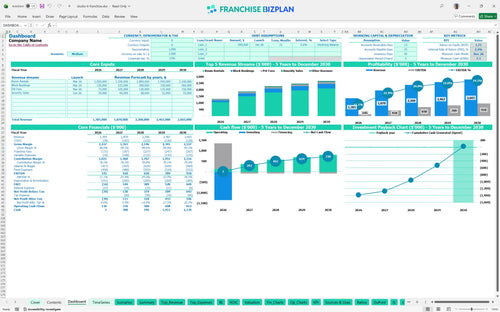
All-in-one Dashboard
Core inputs and core outputs


The franchise unit financial model template provides a comprehensive, research-backed spreadsheet for forecasting revenue, managing expenses, and analyzing the total return on investment for an extended-stay property.
Core inputs and core outputs
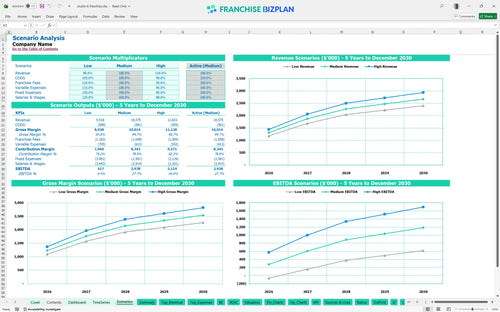
Three scenario analysis
Presentation ready
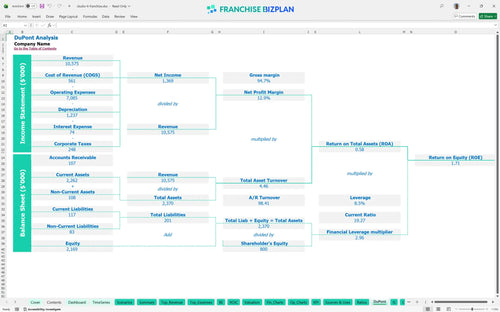
DuPont analysis
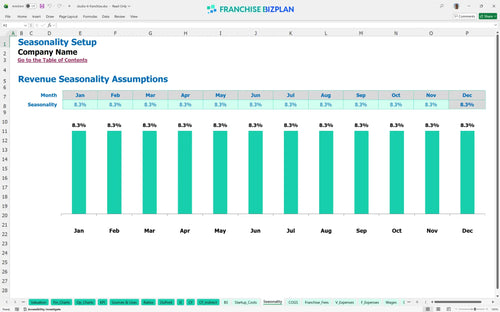
Researched revenue assumptions
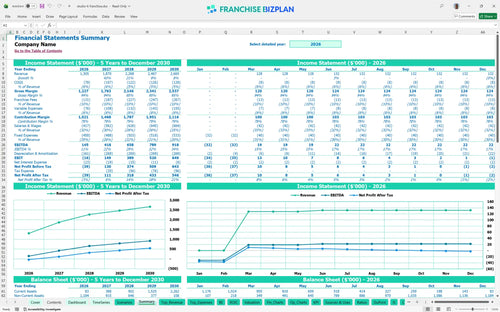
Lender-friendly financial outputs
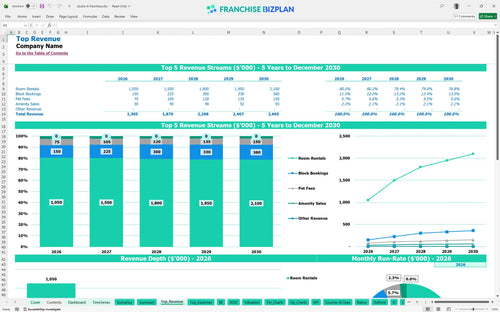
Revenue stream detailed view
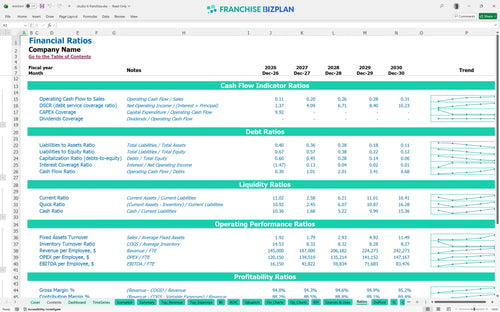
Performance metrics benchmark
We built this Studio 6 Franchise franchise unit financial model using our own research to ensure it reflects the realities of the economy extended-stay market. Key assumptions, including revenue from room rentals and pet fees, are pre-populated with data showing a Year 1 revenue of $1,305,000 and an EBITDA of $145,000. These inputs are fully editable, allowing you to adjust for local medical corridor demand or specific B2B contract rates.
This franchise unit is projected to become profitable in its first year, with EBITDA growing from $145,000 in Year 1 to $918,000 by Year 5. Profitability is driven by scaling revenue while maintaining a lean operating budget template for hotel franchisees, especially as housekeeping supplies and laundry costs drop as a percentage of sales.
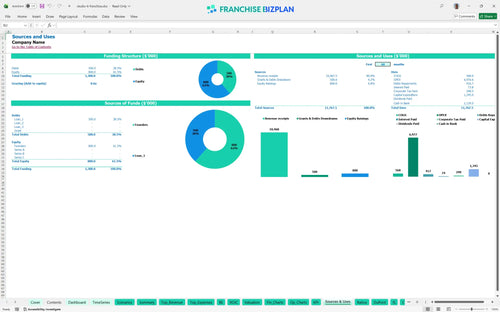
Launching this unit in the US requires an initial investment of roughly $1,345,000, covering everything from the $25,000 franchise fee to $800,000 in leasehold improvements. The allocation includes $150,000 for furniture and $120,000 for HVAC systems, plus a $50,000 contingency fund to handle pre-opening surprises.
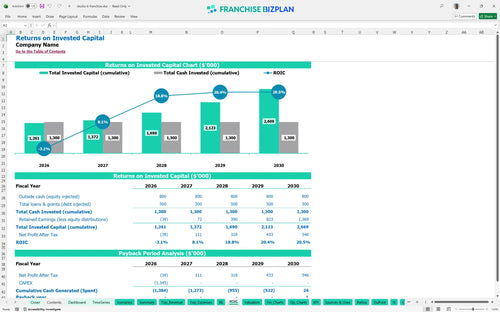
Investors can expect an Internal Rate of Return (IRR) of 2.19% and a Return on Equity (ROE) of 1.71 over the five-year period. The payback period is estimated at 5 years, which is standard for a capital-intensive business model for extended-stay lodging development involving significant property improvements.
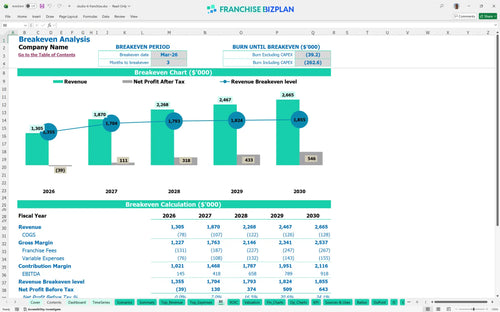
The unit reaches its monthly break-even point in March 2026, just 3 months after the initial launch. The primary driver for this quick turnaround is the ability to secure block bookings early, which helps cover the $25,000 monthly property rent and the fixed $85,000 annual salary for the General Manager.
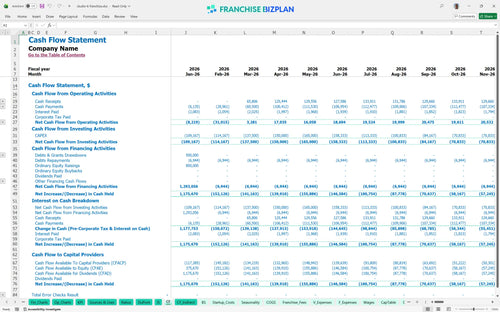
The lowest cash point occurs in December 2026, with a minimum cash balance of $7,000. This is a tight window, so maintaining a cash buffer is defintely recommended to handle any fluctuations in hotel occupancy projections or unexpected maintenance issues during the first year of operation.
Switching to a High scenario by increasing occupancy in the medical corridor significantly improves the Year 1 EBITDA and shortens the payback period. A Low scenario, perhaps due to slower B2B contract acquisition, would increase the peak cash need and could push the break-even date past the 3-month mark, requiring more working capital.
This franchise unit financial model is fully customizable in Excel, allowing you to adjust every variable from room rates to linen costs. It uses pre-filled formulas and editable assumptions that make it easy to adapt to a specific location and operating scenario. Whether you are adjusting for local labor laws or specific property taxes, the model remains logically linked to ensure your projections stay accurate.

Long-term planning is essential for any hotel investment feasibility study, and this model provides a detailed 5-year view of your financial future. It maps out revenue growth from $1.3 million in year one to over $2.6 million by year five, accounting for the ramp-up period of a new property. You can track how cash flow and profit projections evolve as the unit matures and stabilizes within its market.

Understanding the real economics of a franchise requires a clear view of your ongoing obligations to the brand. This model captures the 5% royalty fee and 5% marketing fee contributions, ensuring you know exactly how much gross revenue leaves the unit before local overhead. By including the initial $25,000 franchise fee, the model provides a precise calculation of the total cost of brand alignment.

The franchise startup cost calculator helps you estimate the total initial investment, which reaches approximately $1.34 million in this scenario. It breaks down the build-out, including $800,000 for leasehold improvements and $150,000 for furniture. This allows you to determine the exact sales level required to cover your $25,000 monthly property rent and other fixed costs.

This model incorporates built-in industry benchmarks to help you sanity-check your operating expense ratio against typical economy extended-stay hotels. For example, housekeeping supplies are modeled to scale from 3.5% down to 2.7% of revenue as the team finds operational efficiencies. These benchmarks ensure your labor and occupancy costs remain within a range that supports long-term store-level margins.


Simply purchase and download the financial model template, then access it instantly using Microsoft Excel or Google Sheets. No installation or technical expertise required-just open and start working.

Enter your business-specific numbers, including revenue projections, costs, and investment details. The pre-built formulas will automatically calculate financial insights, saving you time and effort.

Leverage the investor-ready format to confidently showcase your financial projections to banks, franchise representatives, or investors. Impress stakeholders with clear, data-driven insights and professional reports.

Leverage the investor-ready format to confidently present your projections to banks, franchise representatives, or investors.