
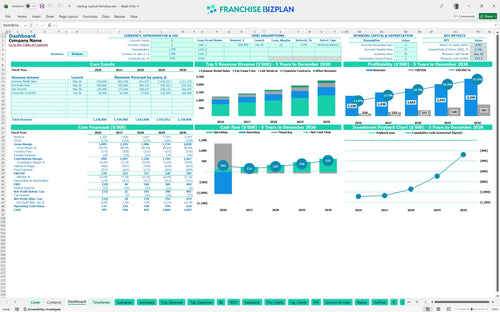
All-in-one Dashboard
Core inputs and core outputs


This Excel financial template for franchise unit operations provides a complete toolkit for analyzing startup costs, five-year profitability, and multi-generational revenue streams.
Core inputs and core outputs
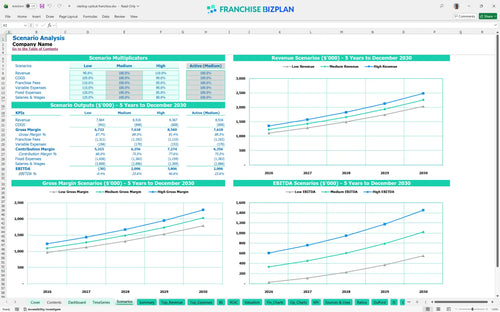
Three scenario analysis
Presentation ready
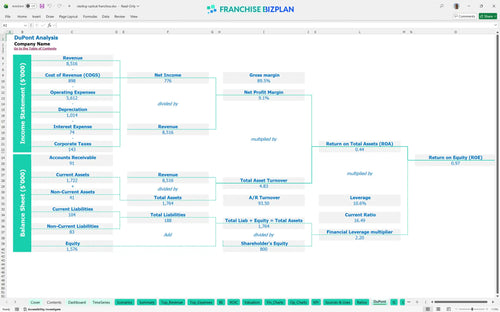
DuPont analysis
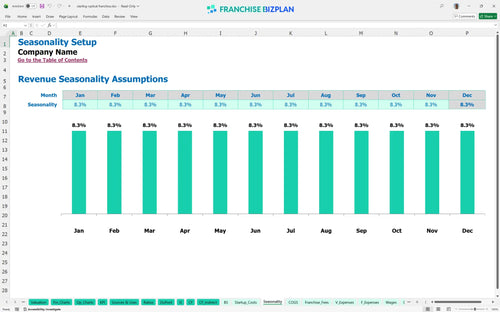
Researched revenue assumptions
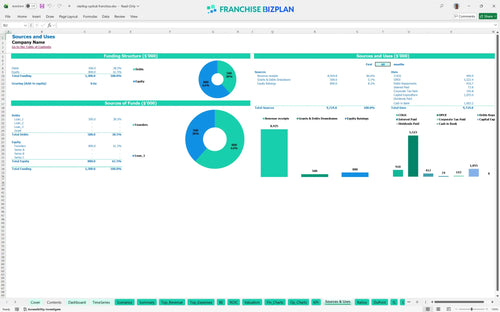
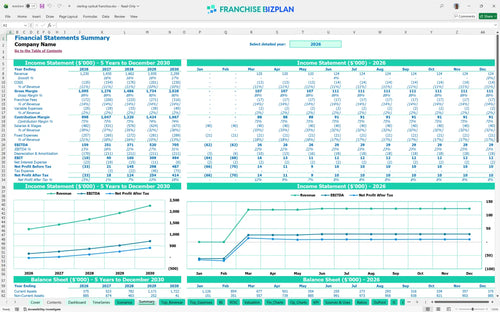
Lender-friendly financial outputs
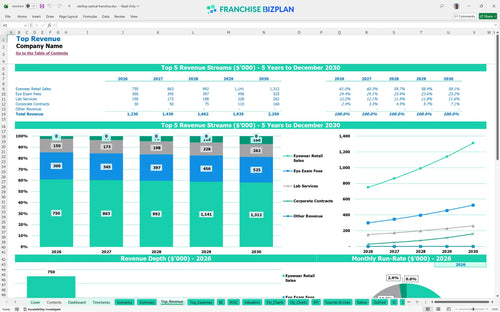
Revenue stream detailed view
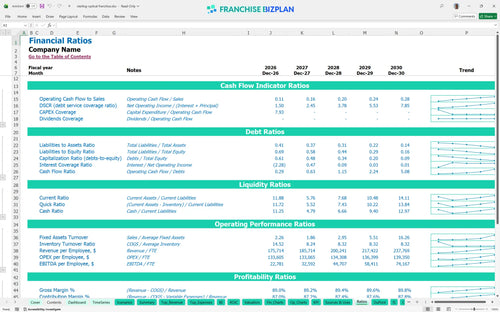
Performance metrics benchmark
We built this franchise unit financial model based on deep research into the optical retail sector, focusing on high-traffic locations and onsite lab efficiencies. The model comes pre-populated with data like a $20,000 franchise fee and $1.05M in total CAPEX, but every line is fully editable to fit your specific market. With Year 1 revenue projected at $1,230,000, you can immediately test how different insurance reimbursements or frame styling volumes impact your bottom line.
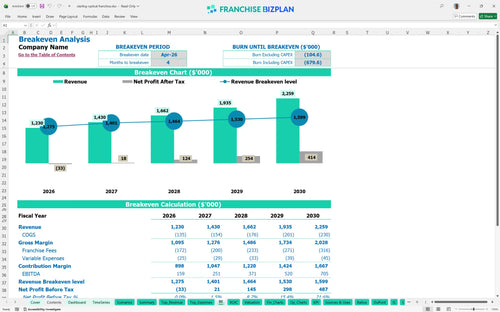
Based on the data, the store reaches operational breakeven in April 2026, just four months after launch. While Year 1 EBITDA is $159,000, true net profitability scales as revenue grows toward the $2.25M mark in Year 5, though the full payback of the $1M+ investment takes longer than five years.
You will need approximately $1,055,000 to cover optical equipment capital expenditure and build-out. This includes $350,000 for leasehold improvements and $400,000 for specialized exam and lab equipment, plus a $172,000 cash buffer to handle the ramp-up phase.
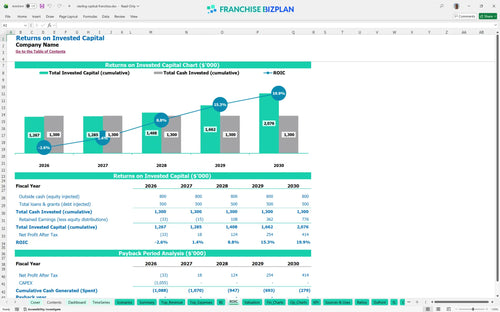
The franchise ROI calculation shows an Internal Rate of Return (IRR) of 1.54% and a Return on Equity (ROE) of 0.97. While the store generates strong annual EBITDA, the high initial startup costs for medical retail locations mean payback occurs after the five-year mark.
The unit hits its break-even point in month 4, requiring enough volume to cover $14,000 in monthly rent and a significant 14% royalty/marketing burden. Success defintely depends on maintaining high eyewear retail sales and efficient eye exam throughput from day one.
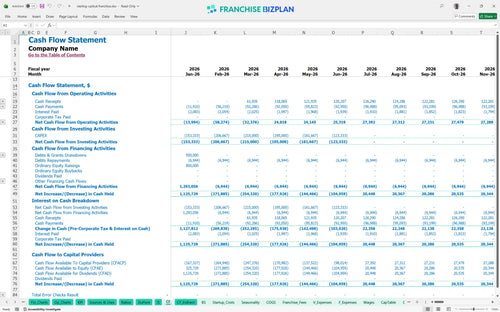
Your lowest cash point is $172,000, projected for June 2026. This small business cash flow projection suggests you need a healthy working capital reserve to navigate the first six months while inventory and staffing costs are high but revenue is still ramping.
Profitability analysis for retail optical business units shows that a High scenario-driven by better optical shop revenue stream forecasting-can significantly shorten the payback period. Conversely, a Low scenario with weak corporate contract adoption would push the lowest cash point deeper, requiring more than the planned $172,000 buffer.
Finance: update unit break-even and payback model by Friday.
This franchise financial model template is built in Excel with open formulas, allowing you to tweak every assumption from eyewear sales volume to lab supply costs. You can adjust the optical store business plan template to match your specific territory, whether you are in a high-rent retail corridor or a medical office park.

Scaling a medical franchise financial forecasting tool requires looking beyond the first year of operation. Our model projects revenue growing from $1.23M in year one to over $2.25M by year five, giving you a clear view of long-term store-level EBITDA and how to estimate startup costs for an optical franchise over a full cycle.

Managing a 14% combined top-line hit for royalties and marketing is a major part of your franchise investment analysis. This tool calculates these monthly obligations automatically, ensuring you see the impact of an 8% royalty and 6% brand fund on your net margins and overall franchise unit profit and loss statement.

Calculating break-even point for optical retail store operations is critical when your initial investment exceeds $1M. With leasehold improvements at $350,000 and equipment totaling $400,000, you need to know exactly when your cash flow turns positive to ensure a successful financial feasibility study for retail optical franchise units.

We use retail optometry business operations data to set realistic targets for labor and COGS. For instance, frames and lenses are modeled at roughly 9.5% of sales, helping you use this franchise unit performance benchmarking template to compare your store against typical industry ranges.


Simply purchase and download the financial model template, then access it instantly using Microsoft Excel or Google Sheets. No installation or technical expertise required-just open and start working.

Enter your business-specific numbers, including revenue projections, costs, and investment details. The pre-built formulas will automatically calculate financial insights, saving you time and effort.

Leverage the investor-ready format to confidently showcase your financial projections to banks, franchise representatives, or investors. Impress stakeholders with clear, data-driven insights and professional reports.

Leverage the investor-ready format to confidently present your projections to banks, franchise representatives, or investors.