
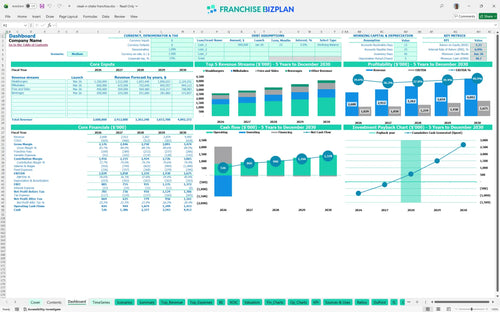
All-in-one Dashboard
Core inputs and core outputs


This comprehensive template includes a fully integrated pro forma, CAPEX schedule, and staffing plan built specifically for high-volume burger and shake operations.
Core inputs and core outputs
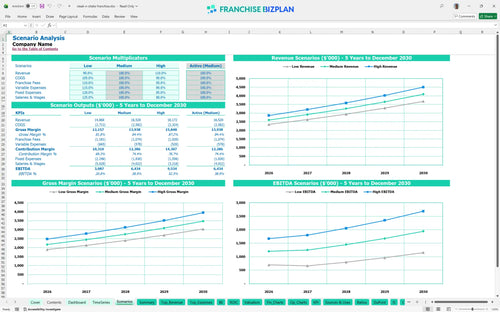
Three scenario analysis
Presentation ready
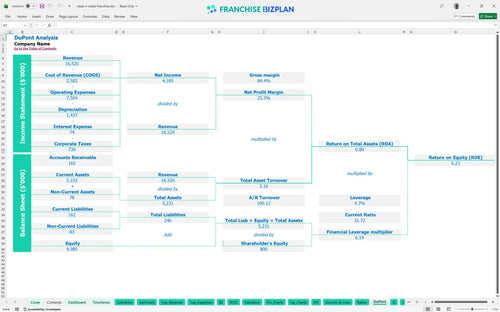
DuPont analysis
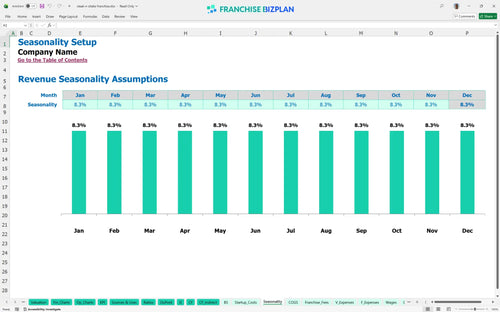
Researched revenue assumptions
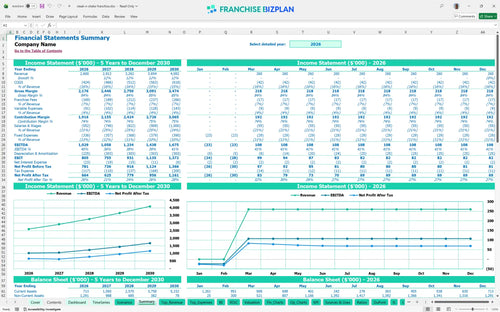
Lender-friendly financial outputs
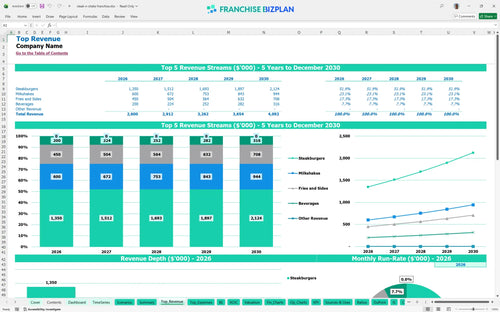
Revenue stream detailed view
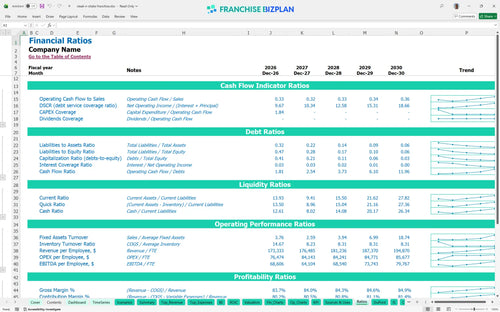
Performance metrics benchmark
We built this franchise unit financial model using our own research to ensure your projections are grounded in reality. Key assumptions like the $1.5M+ build-out and the 6.5% total brand fees are pre-populated and fully editable to match your specific site. Honestly, seeing a Year 1 EBITDA of $1,029,000 helps you understand the scale required to make the investment work.
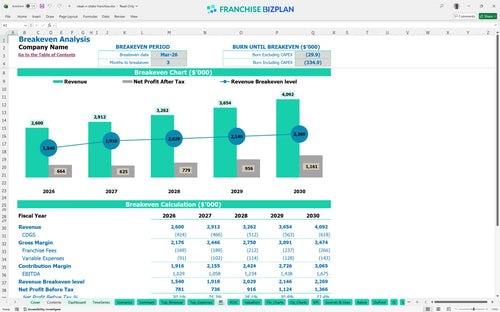
This franchise profitability analysis shows the unit hits profitability fast, reaching its break-even point in March 2026, just three months after opening. Year one net profit is strong because the model assumes high volume from the dual-lane drive-thru and efficient food costs starting at 13.5%. Speed in the kitchen equals money in the bank.
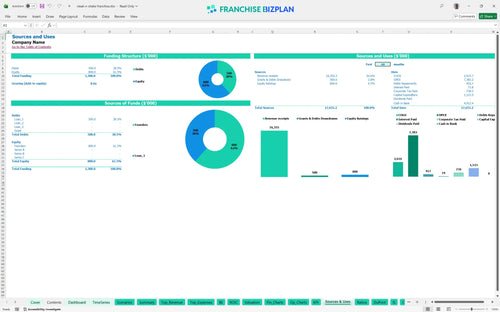
How to calculate startup costs for a fast food franchise starts with the $1,515,000 capital expenditure budget, which covers everything from the initial fee to the drive-thru lane. You need a total investment that includes the $25,000 brand fee and a $49,000 cash buffer to handle the ramp-up phase. Build-outs always cost more than you think.
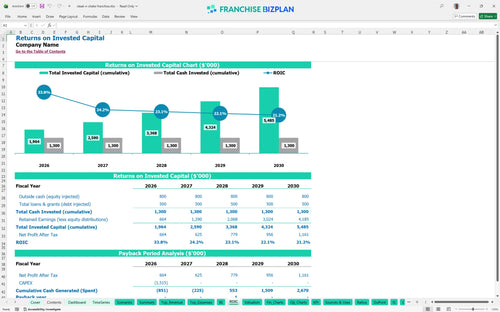
Calculating return on investment for burger franchise units shows a 3-year payback period, which is defintely competitive for a high-CAPEX food concept. The model projects a 6.01% Internal Rate of Return (IRR) and a 5.23% Return on Equity (ROE) based on the 5-year cash flow. A three-year payback is a solid win.
You reach break-even in month 3, but staying there requires hitting high daily traffic counts to cover the $20,000 monthly rent and $3,200 in utilities. Estimating labor costs for high volume drive thru restaurants is critical, as you'll be managing over 14 staff members during peak hours. Volume cures almost every financial ill.
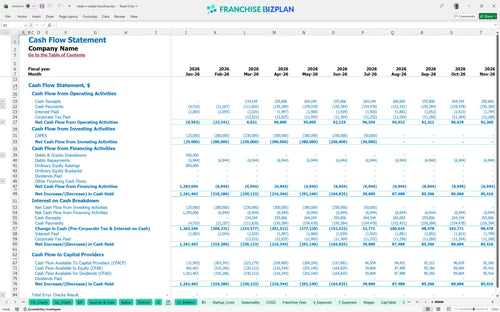
The operational cash flow forecast shows the lowest cash point hits in June 2026 at $49,000, which is tight but manageable if you stick to the plan. You need enough runway to cover the high insurance and rent costs that start before the grand opening in March. Watch the pennies and the millions follow.
This franchise investment feasibility study template compares scenarios to show how a 10% drop in revenue affects your profit and loss projection for new franchise units. In the high-performance case, hitting $4,092,000 in sales early significantly boosts your year-1 margin and moves the peak cash need earlier. Plan for the worst, but execute for the best.
Finance: update unit break-even and payback model by Friday.
This franchise financial model is a fully customizable excel template for restaurant franchise owners that lets you tweak every variable from burger prices to night-shift wages to see how they hit your bottom line. Since every territory has different labor rates and rent, the editable assumptions ensure your plan reflects the actual street corner you're eyeing. Every dollar in rent you save is a dollar in profit.

Our fast food franchise financial projections map out your growth from a $2,600,000 opening year to over $4,092,000 by year five, accounting for annual price climbs and efficiency gains. This long-range view helps you plan for equipment refreshes and debt service without getting caught off guard by cash gaps. Growth is great, but cash flow is king.

The franchise royalty fee calculator tracks the 5.5% royalty and 1.0% marketing fee against your gross sales so you know exactly what's leaving the building every month. It also handles the $25,000 initial fee and ongoing brand obligations to keep your net margin calculations honest. Royalties are a tax on top-line, not bottom-line.

Our break-even analysis spreadsheet helps you calculate the exact sales volume needed to cover your $20,000 monthly rent and heavy staffing requirements for a high-volume drive-thru. We help you estimate the total initial investment and the monthly cost structure required to keep the lights on. Break-even is your first real milestone.

This restaurant franchise business plan includes built-in benchmarks for managing operational expenses for retail food franchises, helping you sanity-check your protein and labor costs. Comparing your 13.5% initial food cost against industry standards helps you spot waste or pricing errors before they tank your EBITDA. Don't guess when you can benchmark.


Simply purchase and download the financial model template, then access it instantly using Microsoft Excel or Google Sheets. No installation or technical expertise required-just open and start working.

Enter your business-specific numbers, including revenue projections, costs, and investment details. The pre-built formulas will automatically calculate financial insights, saving you time and effort.

Leverage the investor-ready format to confidently showcase your financial projections to banks, franchise representatives, or investors. Impress stakeholders with clear, data-driven insights and professional reports.

Leverage the investor-ready format to confidently present your projections to banks, franchise representatives, or investors.