
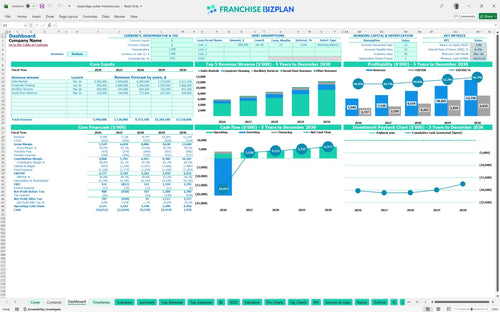
All-in-one Dashboard
Core inputs and core outputs


This hotel unit financial projection provides a complete roadmap for investors, covering everything from construction CAPEX to five-year P&L statements.
Core inputs and core outputs
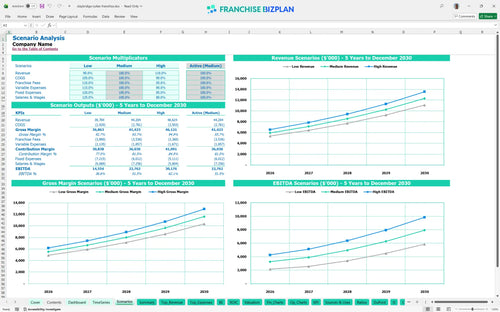
Three scenario analysis
Presentation ready
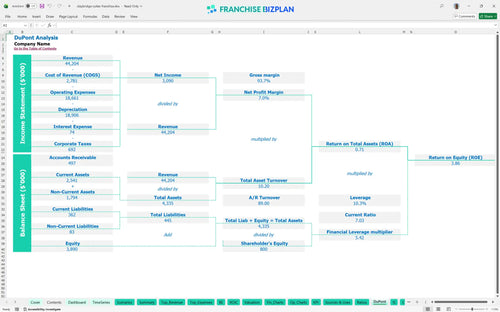
DuPont analysis
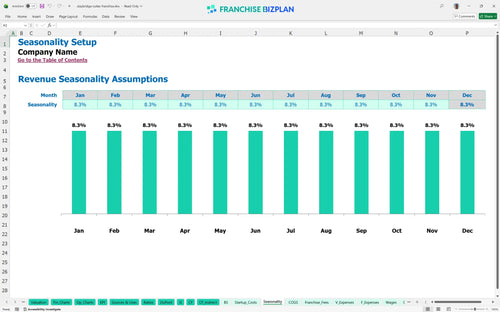
Researched revenue assumptions
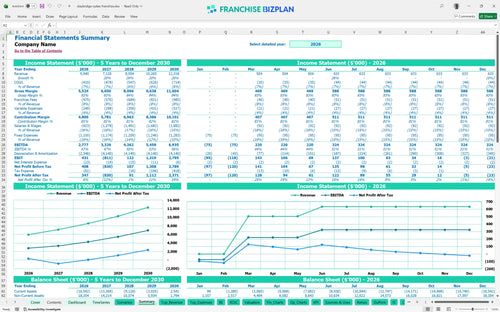
Lender-friendly financial outputs
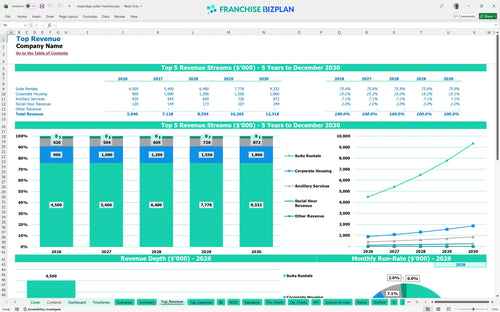
Revenue stream detailed view
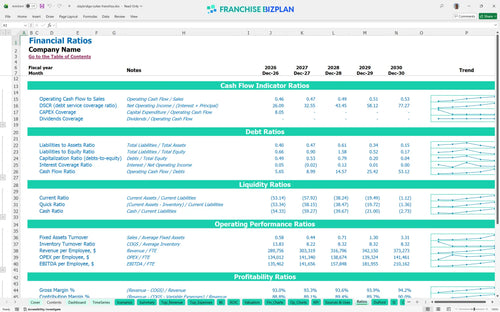
Performance metrics benchmark
We built this financial model for an upscale extended stay franchise using deep market research to ensure accuracy. Key assumptions like suite rental tiers and the $21,000,000+ total development cost are pre-populated and fully editable to match your specific territory. This tool helps you analyze franchise unit profitability in the hospitality industry with confidence.
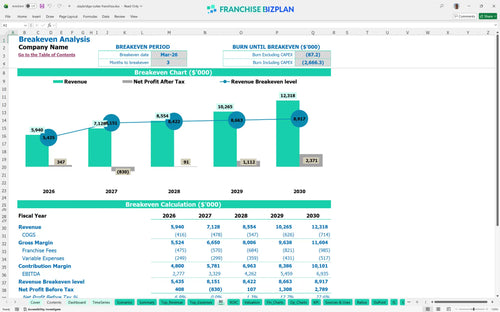
You can expect to hit operational breakeven by March 2026, just three months after the primary launch. While year-one EBITDA is a strong $2,777,000, the massive initial investment means you are playing a long game for total equity return.
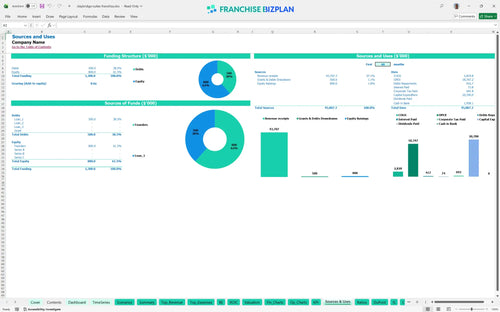
Launching this unit requires significant capital, primarily driven by the $12,000,000 construction cost and $4,500,000 for suite furnishings and kitchens. Total initial outlays exceed $21,000,000 when you include the $75,000 franchise fee and a $1,225,000 contingency fund.
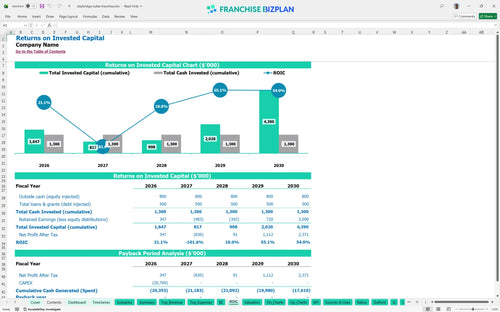
The model shows an Internal Rate of Return (IRR) of 17% and a Return on Equity (ROE) of 3.86. While the project is highly cash-flow positive with EBITDA reaching $6,935,000 by year five, the high development budget means full payback happens after the five-year mark.
You reach the break-even point in March 2026, assuming you hit your initial suite rental targets. The primary driver here is occupancy rate forecasting, as your fixed costs like the $45,000 monthly lease and $12,000 property taxes do not budge regardless of guest count.
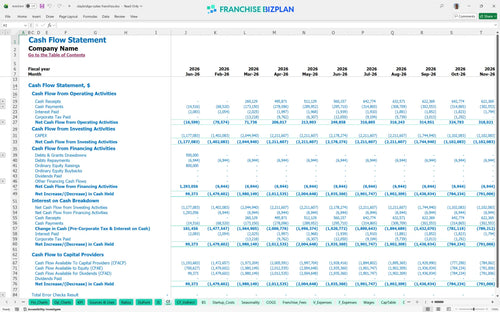
The lowest cash point hits -$16,912,000 in December 2026, reflecting the heavy construction spend before revenue fully ramps. You will defintely need a robust financing package or equity partner to bridge the gap until the $5,940,000 in year-one revenue starts flowing.
A 10% drop in RevPAR calculation can delay your break-even by several months and increase the peak cash need. Conversely, hitting the high case through better corporate housing rates significantly boosts your year-one EBITDA margin above the base $2,777,000.
This hotel franchise financial model is built in Excel with open formulas, so you can tweak every assumption from RevPAR (Revenue Per Available Room) to local utility rates. It handles the heavy lifting of hospitality accounting while letting you adjust for your specific market and site conditions.

Mapping out a five-year horizon is critical for an extended stay hotel business plan because ramp-up periods for large-scale assets take time. This model projects $5,940,000 in year-one revenue, scaling to over $12,318,000 by year five, giving you a clear view of long-term cash flow and balance sheet health.

Managing brand costs is a major part of budgeting for hotel franchise royalty and marketing fees. This tool automatically calculates the 5.5% royalty and 2.5% marketing fund contributions based on your projected suite rentals and corporate housing revenue to show true store-level margin.

Learning how to calculate startup costs for a hotel franchise is the first step toward securing financing. With a $12,000,000 building budget and $4,500,000 for suite furnishings, the model identifies the exact sales volume needed to cover your $45,000 monthly rent and other fixed overhead.

We've baked in operating expense benchmarks for extended stay hotels to ensure your projections stay realistic. From housekeeping supplies at 2.5% of revenue to a $130,000 General Manager salary, these numbers help you sanity-check your hospitality franchise startup costs against industry norms.


Simply purchase and download the financial model template, then access it instantly using Microsoft Excel or Google Sheets. No installation or technical expertise required-just open and start working.

Enter your business-specific numbers, including revenue projections, costs, and investment details. The pre-built formulas will automatically calculate financial insights, saving you time and effort.

Leverage the investor-ready format to confidently showcase your financial projections to banks, franchise representatives, or investors. Impress stakeholders with clear, data-driven insights and professional reports.

Leverage the investor-ready format to confidently present your projections to banks, franchise representatives, or investors.