
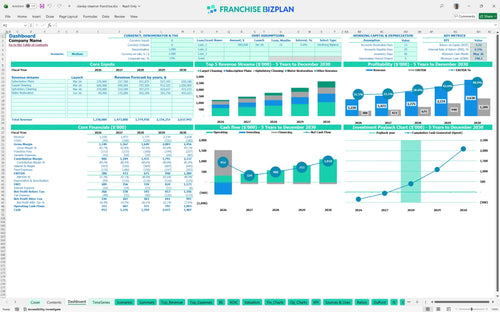
All-in-one Dashboard
Core inputs and core outputs


This financial model template for service-based franchise units provides a complete roadmap from initial capital outlay to five-year exit valuation. This is your financial command center.
Core inputs and core outputs
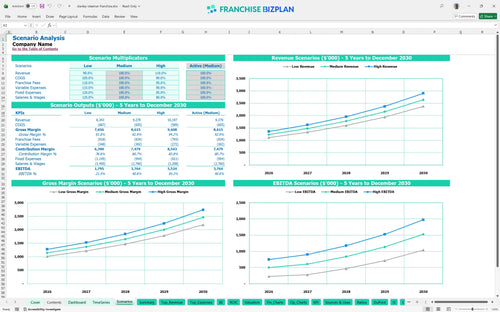
Three scenario analysis
Presentation ready
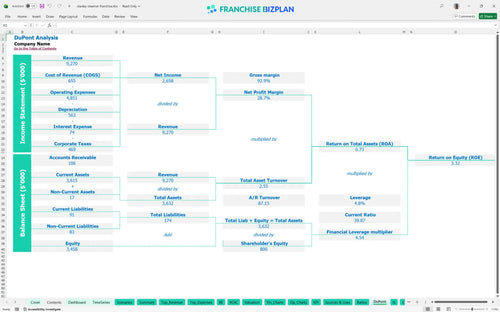
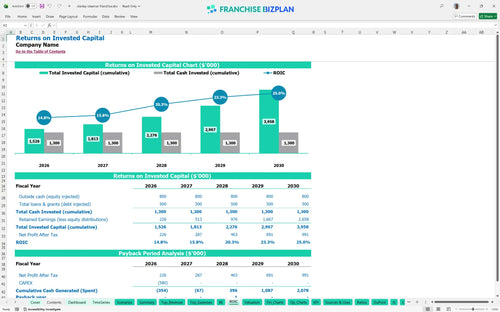
DuPont analysis
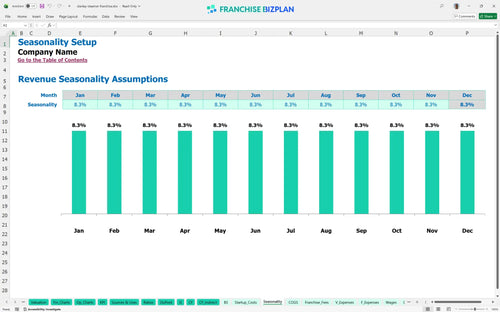
Researched revenue assumptions
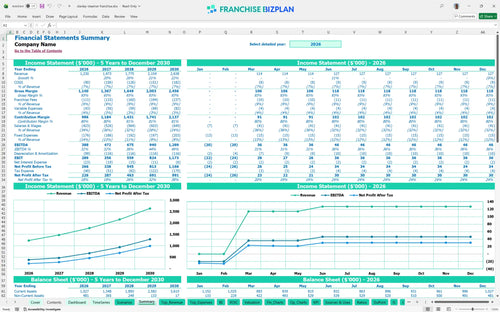
Lender-friendly financial outputs
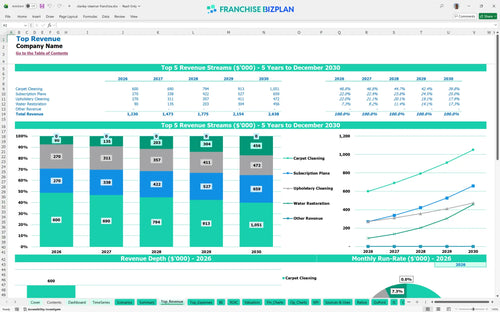
Revenue stream detailed view
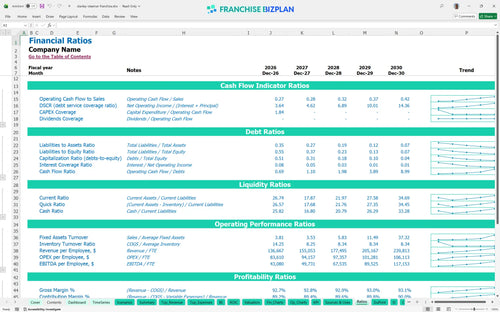
Performance metrics benchmark
We built this franchise unit financial model using our own research into the premium cleaning sector to help you plan with confidence. Key assumptions, including the $1.23M first-year revenue and the 7% royalty structure, are pre-populated and fully editable to match your specific market. This tool ensures you aren't guessing when it comes to technician wages or fleet maintenance costs.
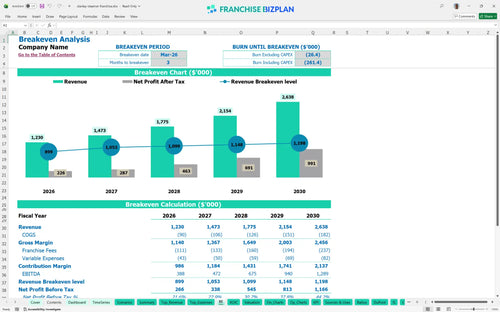
The model shows your unit becoming profitable by March 2026, just three months after opening. By Year 3, EBITDA is projected to hit $675,000 as you scale your technician count to five full-time employees and expand water restoration services. Speed to profit is the name of the game.
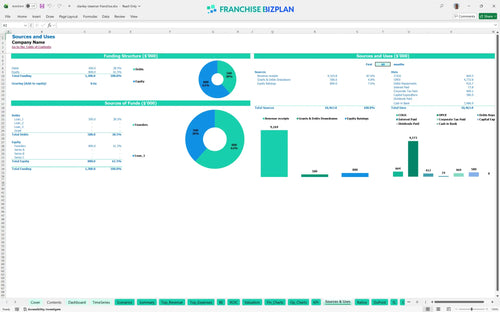
You will need a capital expenditure budget of approximately $580,000 to cover the initial setup in the US. This includes the $100,000 franchise fee, $180,000 for the van fleet, and $120,000 for leasehold improvements at your Scottsdale hub. Capital is your fuel; use it wisely.
Investors can expect a 3-year payback period with an IRR of 6.53% based on the current revenue trajectory. Pro forma financial statements for franchise opportunities show that by Year 5, annual EBITDA can reach $1.28M, providing a return on equity of 3.32%. Cash on cash is what matters most.
The monthly break-even point is reached in month three, driven primarily by the $400,000 annual carpet cleaning base. Analyzing recurring revenue models for cleaning franchises shows that your $9,500 monthly rent and 9% royalty/marketing burden require steady weekly traffic to maintain margins. Volume solves many problems, but margin solves them all.
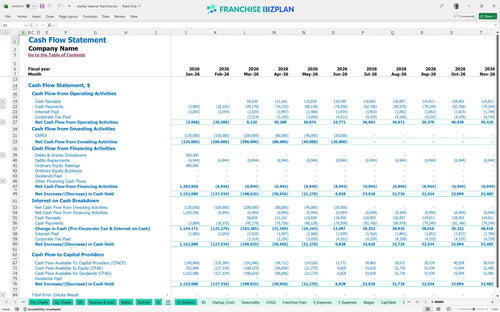
Your lowest cash point hits $748,000 in May 2026, meaning you need to manage your $580,000 in upfront CAPEX carefully. Best practices for franchise unit cash flow forecasting and a solid financial planning guide for new franchise owners suggest keeping a buffer for the first six months. Cash is king, especially in the first six months.
A 10% revenue increase can boost your Year 1 EBITDA from $388,000 to over $420,000, while a downturn delays your 3-year payback. Using a cleaning business franchise profit margin calculator helps you see how technician productivity directly impacts your ability to hit the $2.6M Year 5 target. Plan for the best, but model for the worst.
This franchise unit financial model is fully customizable in Excel, allowing you to adjust every variable from technician wages to chemical costs. It features pre-filled formulas and editable assumptions that make it easy to adapt to your specific territory and local labor market. Every cell is open for your input.

Map out your growth from a single van to a full fleet with detailed 5-year revenue forecasting and profit projections. This business plan spreadsheet for franchises helps you visualize how scaling from $1.23M in year one to over $2.6M by year five impacts your bottom line. Five years of data gives you the full picture.

We baked the 7% royalty and 2% marketing fund contributions directly into the cash flow logic to show the true cost of brand support. By tracking these alongside the initial $100,000 franchise fee, you get a clear picture of how much revenue actually stays in your pocket. Royalties are a fact of life; track them early.

Use the franchise startup cost calculator to estimate your total entry price, including the $180,000 van fleet and $120,000 in leasehold improvements. The model pinpoints exactly when your monthly revenue covers both fixed hub rent and variable chemical expenses, defintely reducing the guesswork. Knowing your zero-point is the first step to profit.

Compare your projected 5.8% chemical cost or 2.2% fuel expense against industry operating expenses to ensure your unit stays competitive. These benchmarks help you identify if your labor spend or rent-to-revenue ratio is out of sync with other premium service providers. Don't fly blind when you can use proven data.


Simply purchase and download the financial model template, then access it instantly using Microsoft Excel or Google Sheets. No installation or technical expertise required-just open and start working.

Enter your business-specific numbers, including revenue projections, costs, and investment details. The pre-built formulas will automatically calculate financial insights, saving you time and effort.

Leverage the investor-ready format to confidently showcase your financial projections to banks, franchise representatives, or investors. Impress stakeholders with clear, data-driven insights and professional reports.

Leverage the investor-ready format to confidently present your projections to banks, franchise representatives, or investors.