
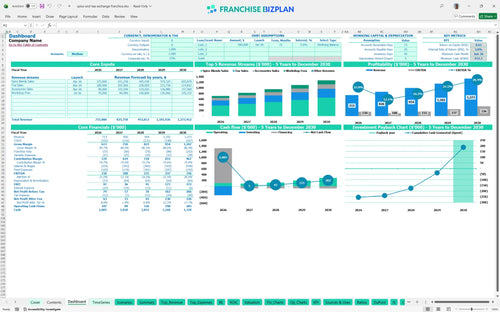
All-in-one Dashboard
Core inputs and core outputs


This franchise financial model template provides a complete financial roadmap for a specialty retail unit, covering everything from build-out costs to multi-year cash flow.
Core inputs and core outputs
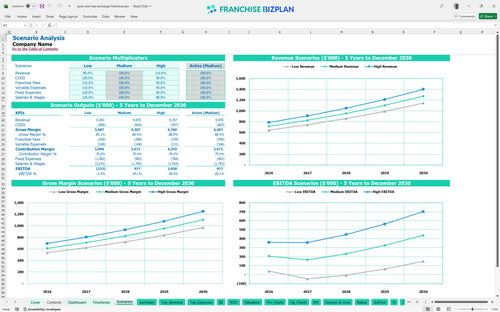
Three scenario analysis
Presentation ready
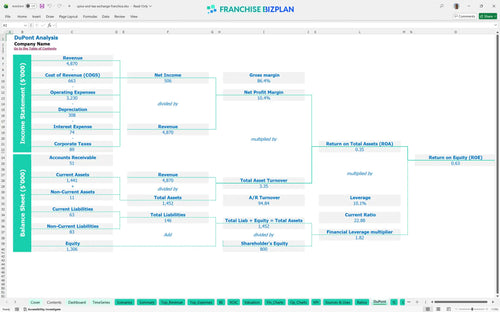
DuPont analysis
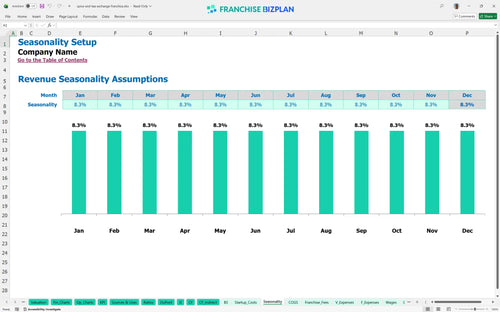
Researched revenue assumptions
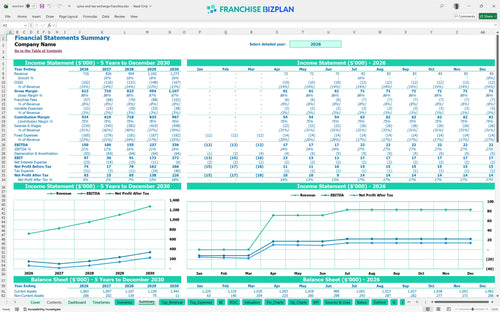
Lender-friendly financial outputs
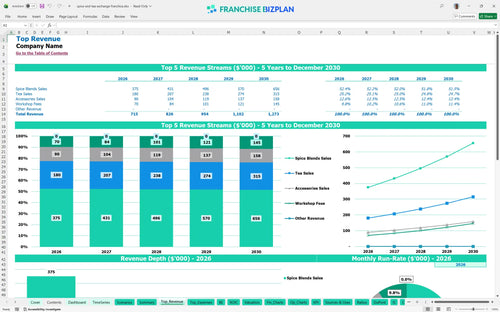
Revenue stream detailed view
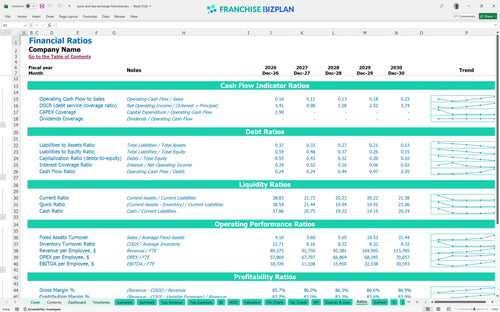
Performance metrics benchmark
We built this franchise unit financial model using detailed research on specialty retail operations. Key assumptions like the 7% royalty fee, $120,000 in initial tea sales, and $318,750 in capital expenditures are pre-populated and fully editable to match your specific site. This tool helps you analyze how workshop fees and spice blend margins drive your $150,000 first-year EBITDA.
Your unit is projected to reach profitability in its first year, with EBITDA starting at $150,000. While Year 2 shows a slight dip to $100,000 due to scaling labor, net profit grows steadily thereafter as you optimize your retail shop inventory management cost analysis.
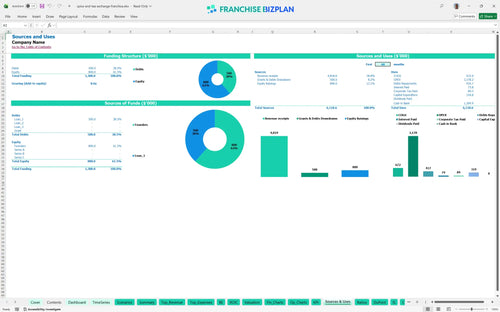
You need approximately $318,750 in initial capital to launch this unit in the US, based on the franchise investment breakdown. This covers the $38,750 franchise fee and significant leasehold improvements to create the required apothecary atmosphere.
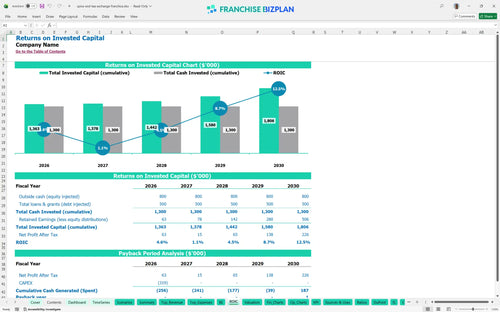
The franchise unit ROI calculator spreadsheet shows a 5-year payback period and an internal rate of return (IRR) of 3.04%. While the IRR is modest, the return on equity of 0.63 reflects a stable long-term asset once the store matures.
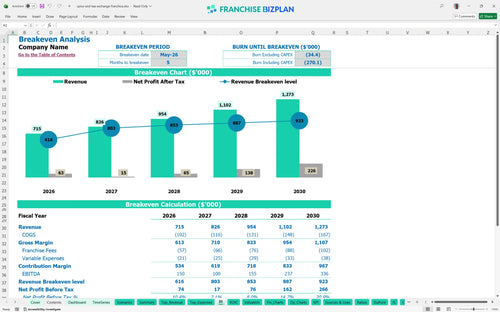
Analyzing break-even point for a retail franchise shows you hit the mark in May 2026, just 5 months after launch. The primary driver is the high fixed rent of $10,000, which requires consistent foot traffic and a strong average ticket from spice blends.
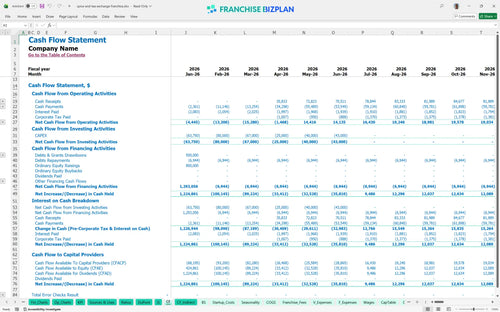
Your lowest cash point occurs in June 2026, with a minimum cash balance of $934,000. You should defintely maintain a buffer to handle the ramp-up period between the January lease start and the April revenue launch.
Comparing Low vs High scenarios shows that a 10% drop in revenue significantly delays your 5-year payback. However, hitting the High case through better local marketing execution can push Year 5 revenue toward $1.4 million and improve your store-level margin.
This franchise unit financial model is fully customizable in Excel, featuring pre-filled formulas and editable assumptions. You can easily adjust variables for your specific territory, local labor rates, and lease terms to see how they impact your bottom line.

Map out your growth with detailed 5-year revenue and cash flow projections designed for a retail franchise business plan. These forecasts help you visualize the climb from initial opening to a mature store generating over $1.2 million in annual sales.

The model captures essential franchise financial obligations like the $38,750 initial fee and ongoing 7% royalty payments. By accounting for the 1% brand fund contribution, you get a clear view of the store-level margin (the profit left after all operating costs) before debt service.

Use this small business financial forecasting tool to estimate your total startup investment and identify your break-even point. With rent at $10,000 monthly, knowing the exact sales volume needed to cover fixed costs is critical for managing early-stage risk.

The model includes built-in benchmarks to help you evaluate your retail store operating expenses against industry standards. Comparing your labor costs and occupancy ratios to typical ranges ensures your projections remain realistic and bank-ready.


Simply purchase and download the financial model template, then access it instantly using Microsoft Excel or Google Sheets. No installation or technical expertise required-just open and start working.

Enter your business-specific numbers, including revenue projections, costs, and investment details. The pre-built formulas will automatically calculate financial insights, saving you time and effort.

Leverage the investor-ready format to confidently showcase your financial projections to banks, franchise representatives, or investors. Impress stakeholders with clear, data-driven insights and professional reports.

Leverage the investor-ready format to confidently present your projections to banks, franchise representatives, or investors.