
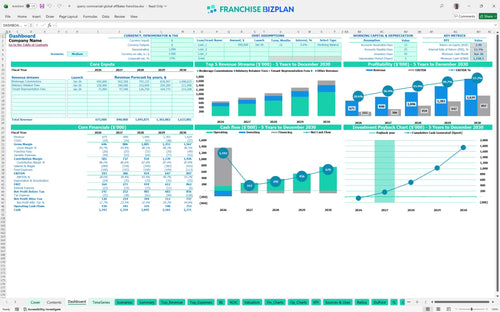
All-in-one Dashboard
Core inputs and core outputs


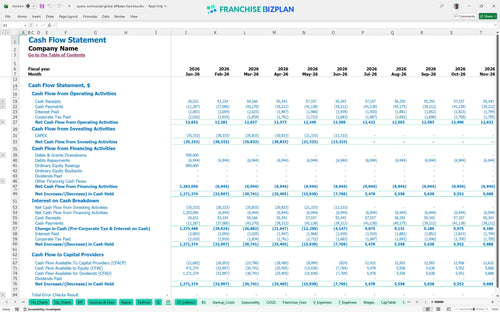
This franchise financial projection spreadsheet includes integrated income statements, cash flow tracking, and startup cost calculators designed specifically for a commercial brokerage unit.
Core inputs and core outputs
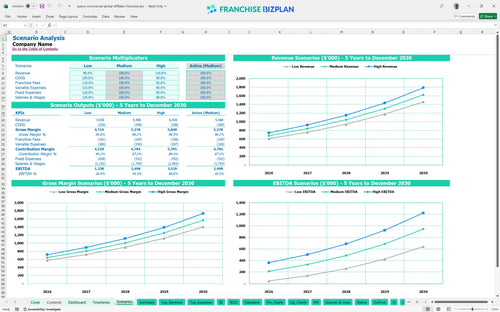
Three scenario analysis
Presentation ready
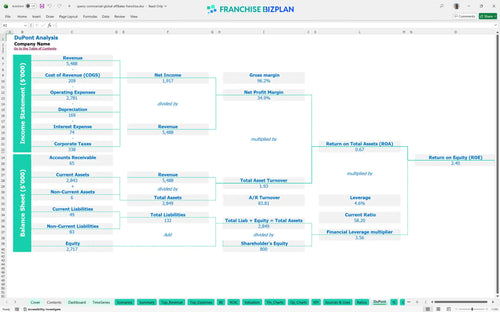
DuPont analysis
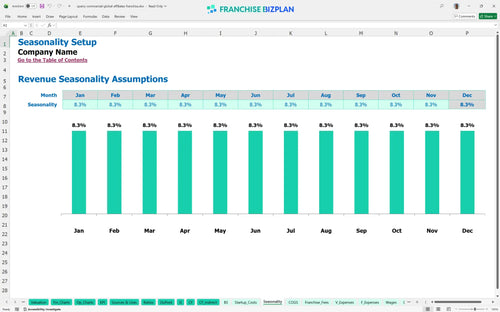
Researched revenue assumptions
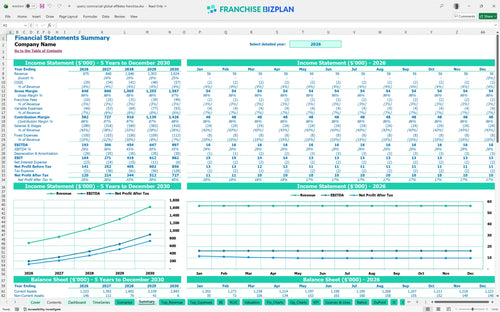
Lender-friendly financial outputs
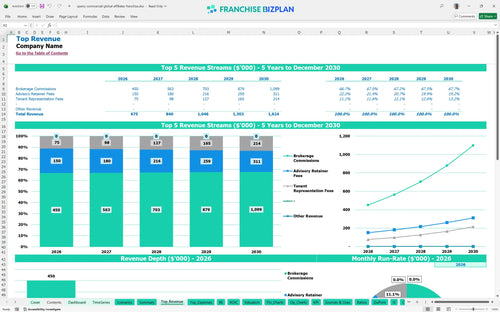
Revenue stream detailed view
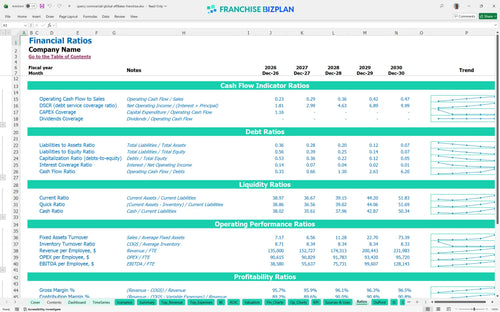
Performance metrics benchmark
We built this franchise unit financial model using deep research into commercial brokerage operations and startup capital requirements for commercial real estate offices. Key assumptions like the $10,000 franchise fee and the $90,000 managing broker salary are pre-populated and fully editable to match your specific location. With a projected year-one EBITDA of $193,000, this model gives you a data-driven starting point for your investment feasibility study.
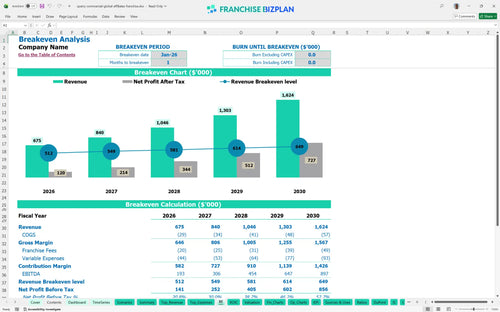
The unit hits profitability almost immediately with a break-even date of January 2026. Because brokerage models rely on high-margin commissions rather than heavy inventory, the path to a $193,000 year-one EBITDA is fast if you hit your $675,000 revenue target. Speed to profit is the ultimate brokerage metric.
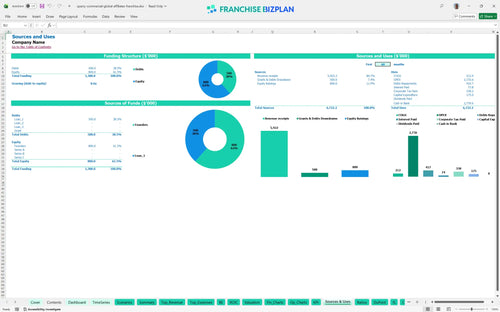
You need a total initial investment that covers $175,000 in hard startup costs plus a significant cash buffer. The model shows a minimum cash requirement of $1,159,000 by June 2026 to handle the ramp-up and working capital needs. Capital is your fuel; don't run out before the first closing.
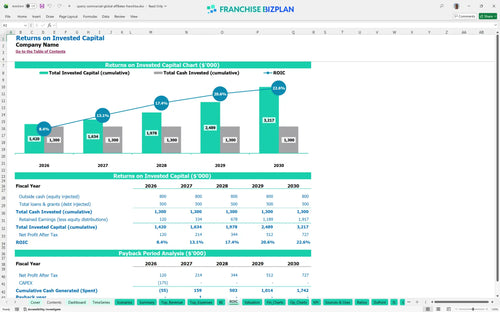
Investors can expect an Internal Rate of Return (IRR) of 12.25% over the first five years of operation. With a Return on Equity (ROE) of 2.4 and a two-year payback period, the model demonstrates strong performance for a service-based franchise. Real estate is a long game with short-term milestones.
The unit reaches break-even in just one month, provided the $300,000 annual commission pace starts on day one. The biggest driver for your break-even point is the fixed payroll of $215,000 for your core staff. Break-even is a psychological victory as much as a financial one.
Your lowest cash point occurs in June 2026, where you will need $1,159,000 on hand to maintain operations. This accounts for the lag between marketing spend and commission payouts during the initial ramp-up. Cash is oxygen for a growing brokerage.
Moving to a High scenario driven by strong tenant representation fees can push year-five EBITDA toward $897,000. A Low scenario would likely push your payback period past the 3-year mark and increase your peak cash need. Scenarios prepare you for the market's inevitable mood swings.
Finance: update unit break-even and payback model by Friday.
This commercial real estate franchise financial model is fully customizable in Excel, allowing you to adjust every variable from broker commission splits to local office rent. It features pre-filled formulas and editable assumptions that make it easy to adapt the projections to your specific territory and local market conditions. You can swap out the researched data for your own numbers to see how different operating scenarios impact your bottom line. Flexibility is the only way to model a volatile real estate market.

Mapping out a five-year horizon is critical for any commercial brokerage startup looking to dominate a tech corridor. This tool tracks your revenue growth from $675,000 in year one to over $1.6 million by year five, accounting for the gradual ramp-up of associate brokers. You get a comprehensive view of your profit and cash flow to ensure you have the capital needed for long-term expansion. Five years of data turns a guess into a strategy.

Royalties and brand funds are the cost of entry for a global network, and this model bakes them directly into your P&L. It calculates the 2% royalty and 1% marketing fee automatically based on your $300,000+ in annual brokerage commissions. This defintely helps you understand the real economics of the brand before you commit to the initial franchise fee. Fees are fixed, but their impact on margin changes as you scale.

Launching a high-end brokerage requires significant upfront capital for items like the $80,000 office buildout and $25,000 in deal room AV equipment. This real estate franchise profitability analysis helps you estimate the total initial investment and the monthly sales volume required to cover your $5,600 rent. Knowing your break-even point on day one reduces the stress of those first few months of operation. Knowing your floor is as important as knowing your ceiling.

We integrated real-world franchise unit performance metrics to keep your projections grounded in reality. If your digital marketing spend deviates from the 4% campaign benchmark, the model flags it for review. These built-in benchmarks help you sanity-check your labor costs and occupancy expenses against industry norms to ensure your plan is realistic. Benchmarks keep your ego in check and your bank account full.


Simply purchase and download the financial model template, then access it instantly using Microsoft Excel or Google Sheets. No installation or technical expertise required-just open and start working.

Enter your business-specific numbers, including revenue projections, costs, and investment details. The pre-built formulas will automatically calculate financial insights, saving you time and effort.

Leverage the investor-ready format to confidently showcase your financial projections to banks, franchise representatives, or investors. Impress stakeholders with clear, data-driven insights and professional reports.

Leverage the investor-ready format to confidently present your projections to banks, franchise representatives, or investors.