


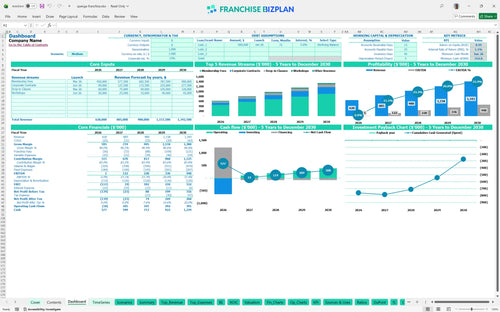
All-in-one Dashboard
Core inputs and core outputs



This Excel template for franchise unit financial forecasting provides a professional-grade tool to model every dollar from the initial $49,500 franchise fee to year-five exit values.
Core inputs and core outputs
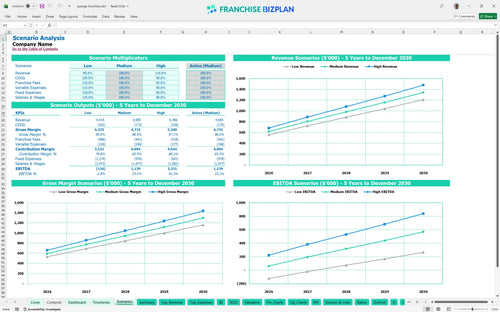
Three scenario analysis
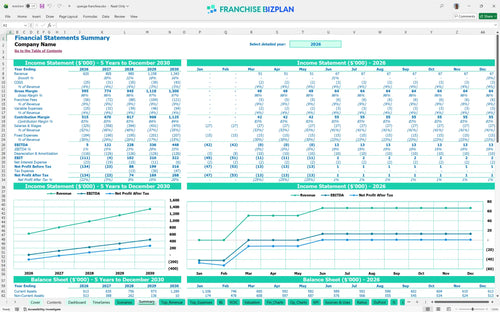
Presentation ready
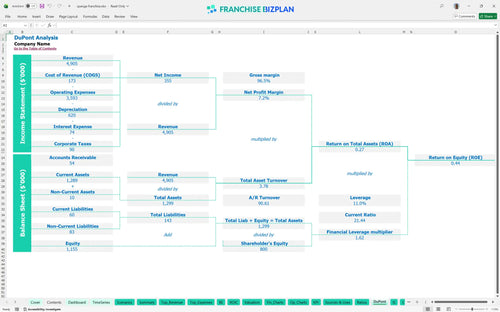
DuPont analysis
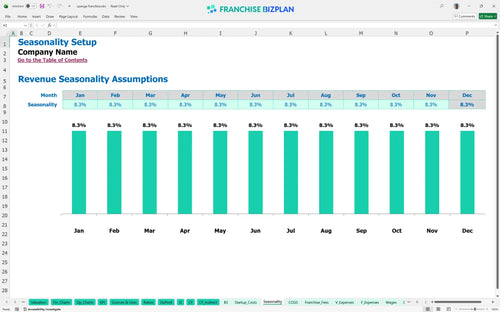
Researched revenue assumptions
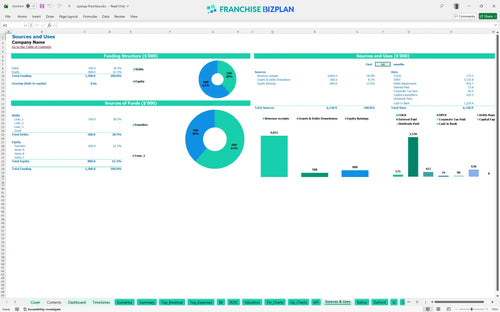
Lender-friendly financial outputs
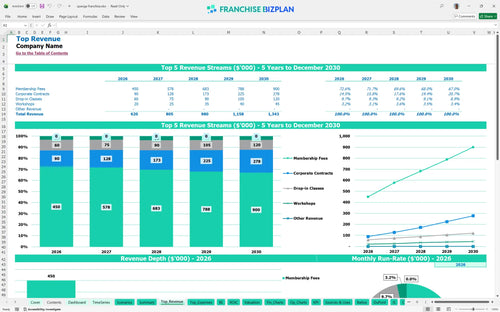
Revenue stream detailed view
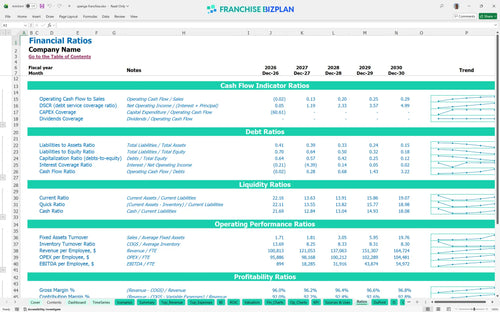
Performance metrics benchmark
We developed this multi-modality gym business financial model using deep research into high-end fitness trends and site-specific costs. Key assumptions for revenue streams, like the $600,000 year-five membership target, and capital investments are pre-populated and fully editable to match your specific territory. This is the complete roadmap for your studio investment.
The studio hits a positive EBITDA of $5,000 in its first year, but the real boutique gym franchise profit margin analysis shows acceleration in year two to $122,000. By year five, you are looking at $448,000 in annual earnings as the membership base matures. Profitability is a function of retention, not just recruitment.
Launching this unit requires a boutique fitness studio startup budget template that accounts for $629,500 in total initial costs. This covers the $49,500 fee, $220,000 in leasehold improvements, and $210,000 for specialized spin and strength equipment. Your biggest checks are written before your first member walks in.
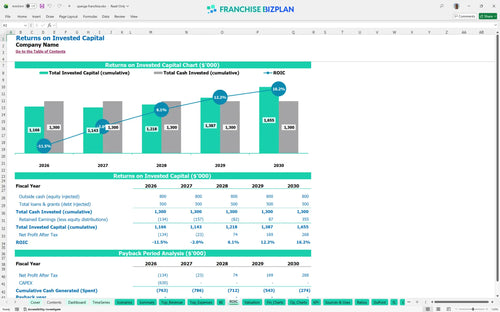
Your ROI calculation shows an internal rate of return of 1.08 and a return on equity of 0.44. While the payback period extends beyond the five-year mark, the $448,000 year-five EBITDA represents a healthy margin on $1.34M in sales. Patience is required when the payback period crosses the five-year line.
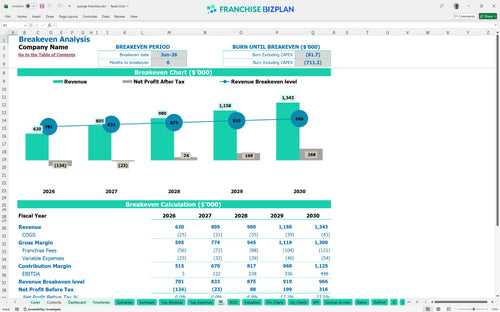
The studio reaches its monthly break-even point in June 2026, roughly six months after the doors open. This fitness franchise operating expense spreadsheet identifies membership volume as the critical lever to cover the $9,500 monthly rent. Break-even is a race against your working capital reserves.
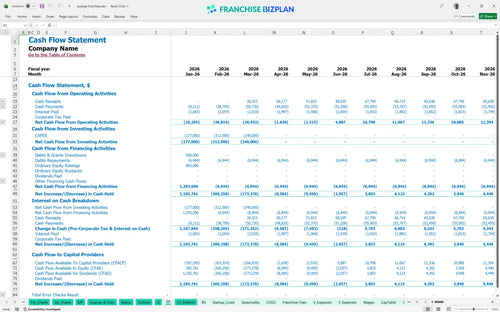
The lowest cash point is $552,000 in June 2026, coinciding with the break-even date. You need a solid recurring revenue model to manage this, as the $220,000 build-out and $120,000 spin bike investment hit the balance sheet early. The lowest cash point is your most vulnerable moment.
Our fitness studio financial projections compare cases to show how a 10% shift in retention impacts the $448,000 year-five profit. High-performance scenarios focus on driving the $185,000 corporate contract stream. Scenarios prepare you for the reality that plans rarely survive contact with the market.
Finance: update unit break-even and payback model by Friday
This franchise financial model template is built in Excel so you can tweak every variable from membership pricing to instructor pay. It uses dynamic formulas and acts as a financial model template for boutique fitness studios, making it easy to adapt to your specific territory and local rent prices. Every 1-point margin leak matters fast in a single-unit model.

Map out your long-term success with a detailed boutique gym business plan that tracks performance through 2030. We provide a full view of your income statement, balance sheet, and cash flow to ensure your franchise profitability analysis holds up as you scale. Timing gaps between opening and maturity are where most owners fail.

Managing the 7% royalty and 2% marketing fund is non-negotiable for brand standards. This model bakes these costs directly into your unit economics so you see exactly how much cash stays in the business after the franchisor takes their cut. Royalties are a tax on top-line, not bottom-line.

Knowing how to calculate startup costs for a fitness franchise is the difference between opening strong and running out of cash. We detail the $629,500 initial outlay, including leasehold improvements and equipment, to find your exact break-even point. Cash is your only oxygen during the build-out phase.

Use our financial planning guide for new franchise owners to compare your $9,500 monthly rent and operational expenses against boutique fitness standards. This helps you defintely spot if your occupancy or payroll is drifting too high before it impacts your bottom line. Benchmarks keep your ego from writing checks your cash flow can't cover.


Simply purchase and download the financial model template, then access it instantly using Microsoft Excel or Google Sheets. No installation or technical expertise required-just open and start working.

Enter your business-specific numbers, including revenue projections, costs, and investment details. The pre-built formulas will automatically calculate financial insights, saving you time and effort.

Leverage the investor-ready format to confidently showcase your financial projections to banks, franchise representatives, or investors. Impress stakeholders with clear, data-driven insights and professional reports.

Leverage the investor-ready format to confidently present your projections to banks, franchise representatives, or investors.