
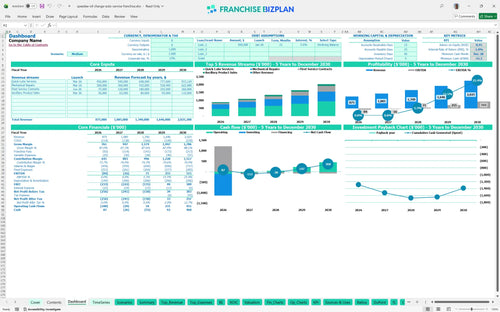
All-in-one Dashboard
Core inputs and core outputs


This comprehensive Excel spreadsheet for franchise startup financial planning includes detailed tabs for revenue forecasting, staffing schedules, CAPEX tracking, and multi-year financial statements.
Core inputs and core outputs
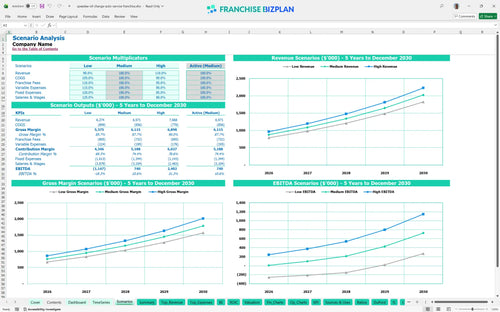
Three scenario analysis
Presentation ready
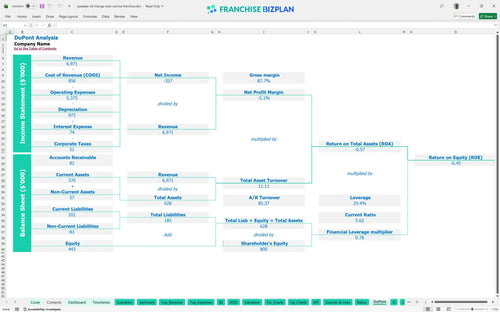
DuPont analysis
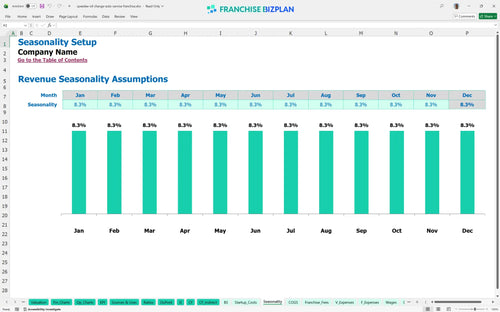
Researched revenue assumptions
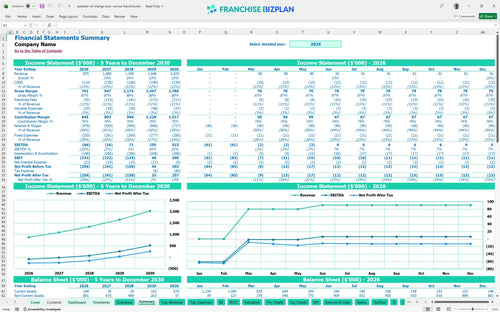
Lender-friendly financial outputs
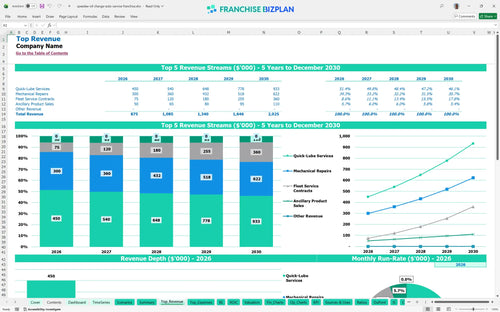
Revenue stream detailed view
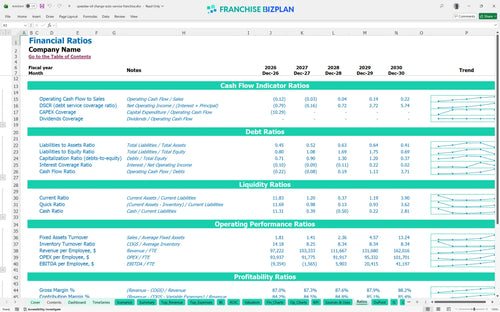
Performance metrics benchmark
We built this quick lube franchise business plan model using detailed research on automotive service unit economics. The assumptions for revenue, including a $300,000 start for quick-lube services, and expenses like the $39,900 franchise fee are pre-populated and fully editable to fit your specific market. This data-driven tool helps you move from guessing to planning with confidence.
Your franchise unit economics show a path to positive EBITDA by Year 3, reaching $71,000 after two years of initial ramp-up. While Year 1 starts with an $84,000 loss, the scaling revenue from mechanical repairs and fleet contracts drives Year 5 profits to $515,000 as the shop reaches maturity.
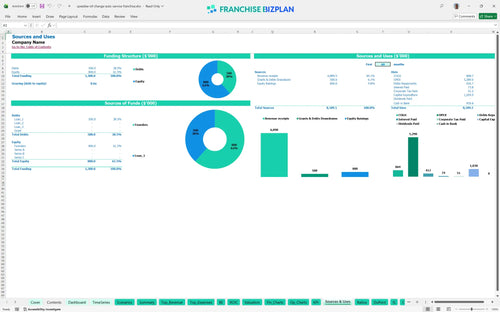
Knowing how to calculate startup costs for an auto repair franchise is vital, as this model requires over $1 million in initial capital. The largest allocations go toward the $450,000 leasehold improvements and $200,000 for automotive lifts, plus a $39,900 initial fee to the franchisor.
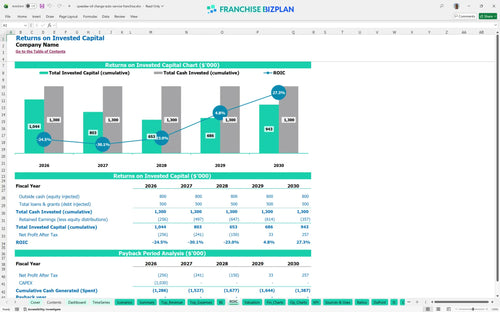
The ROI projections for automotive service center franchise units show that payback defintely occurs after the five-year mark. While the initial IRR is -1% due to heavy front-end CAPEX, the significant jump in Year 5 EBITDA suggests strong long-term equity growth for patient operators.
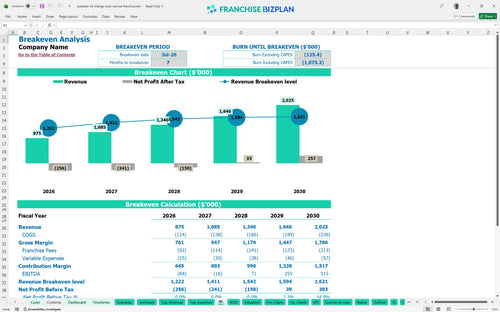
Estimating break-even point for a new automotive franchise shows you will hit the monthly mark in July 2026, just seven months after launch. Your ability to hit this depends on managing the $12,000 monthly rent and the high fixed cost of a skilled $75,000 store manager.
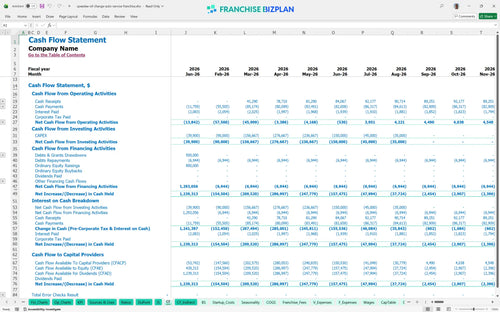
The model identifies a minimum cash point of -$55,000 in December 2028, suggesting you need a solid working capital buffer. Managing recurring revenue for fleet maintenance business contracts will be essential to smoothing out cash flow during the slower winter months of the ramp-up.
Forecasting revenue for independent automotive service franchise units requires looking at all possibilities. A high-growth scenario pushes Year 5 revenue toward $2.5 million, significantly shortening the payback period, while a low-growth case might require additional capital injections to cover the 2028 cash dip.
Finance: update unit break-even and payback model by Friday.
This franchise financial projection template is a flexible Excel tool designed for precision. You can adjust every revenue driver and cost assumption to match your specific territory, whether you are looking at a high-traffic corner or a quieter suburban plot. The pre-filled formulas handle the heavy lifting so you can focus on the strategy.

Success in the automotive sector requires a long-term view of automotive business cash flow. This model provides a detailed five-year roadmap covering everything from initial ramp-up losses to mature-unit stability. You get a clear look at how annual sales growth from $875,000 to over $2 million impacts your bottom line over time.

Operating a branded unit means managing specific recurring obligations that eat into your store-level margin. This tool tracks the 6% royalty and 4.5% marketing fund contributions against your gross sales automatically. It ensures you see the net cash remaining after the franchisor takes their cut each month.

Calculating automotive franchise startup costs is the first step to avoiding a liquidity crunch. The model breaks down the $450,000 build-out and $200,000 equipment needs to show you exactly how much capital you need before the first car enters the bay. It maps out the path to covering your $12,000 monthly rent.

Use these benchmarks to sanity-check your oil change shop investment analysis against industry standards. The model includes typical ranges for labor and consumables, like the 11% target for oil and fluids. Comparing your projected $75,000 manager salary to market rates helps ensure your budget remains realistic and competitive.


Simply purchase and download the financial model template, then access it instantly using Microsoft Excel or Google Sheets. No installation or technical expertise required-just open and start working.

Enter your business-specific numbers, including revenue projections, costs, and investment details. The pre-built formulas will automatically calculate financial insights, saving you time and effort.

Leverage the investor-ready format to confidently showcase your financial projections to banks, franchise representatives, or investors. Impress stakeholders with clear, data-driven insights and professional reports.

Leverage the investor-ready format to confidently present your projections to banks, franchise representatives, or investors.