
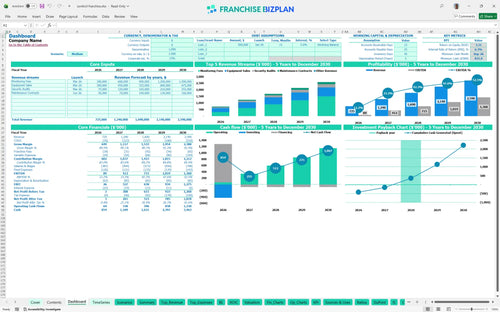
All-in-one Dashboard
Core inputs and core outputs


This financial model for B2B security service franchise provides a detailed roadmap for managing recurring revenue, high-end equipment sales, and multi-year growth.
Core inputs and core outputs
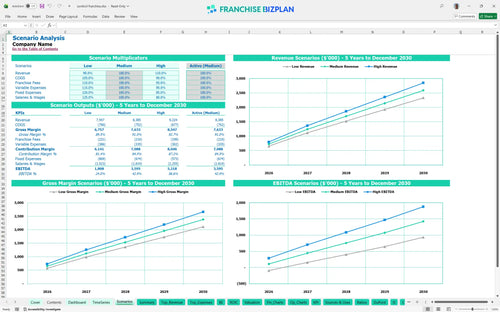
Three scenario analysis
Presentation ready
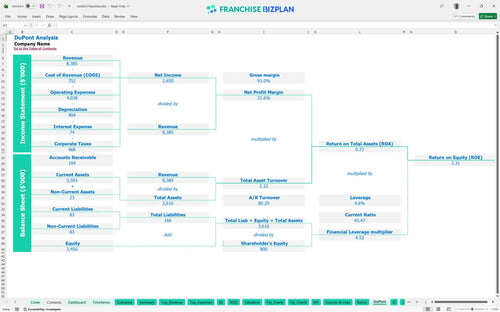
DuPont analysis
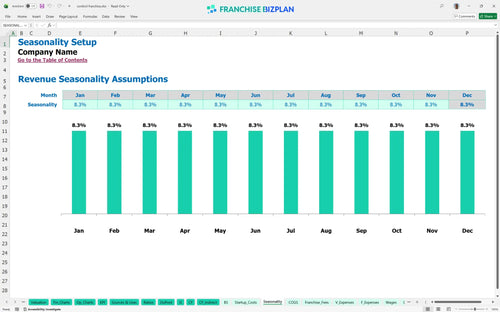
Researched revenue assumptions
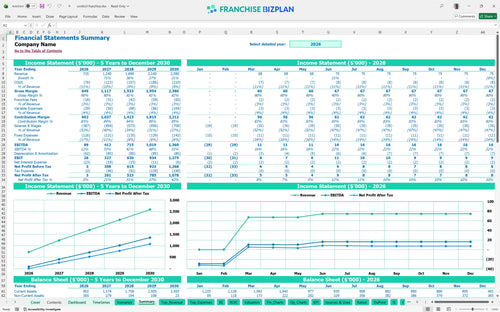
Lender-friendly financial outputs
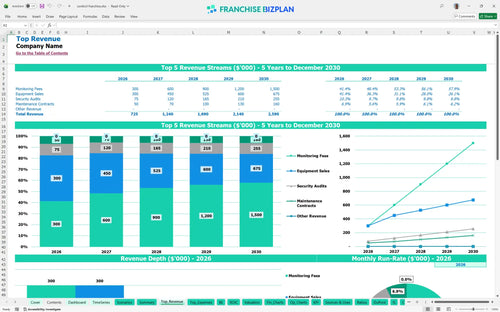
Revenue stream detailed view
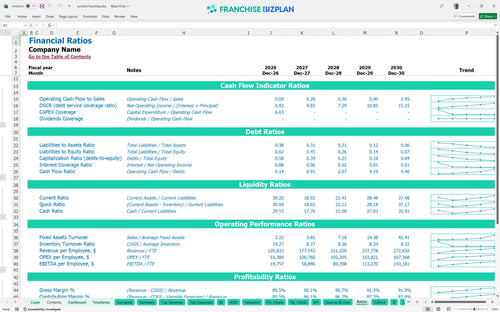
Performance metrics benchmark
We built this franchise unit financial model using our own research into the commercial security sector. Key assumptions like monitoring fees and equipment sales are pre-populated with data specific to this security franchise and are fully editable. With a year-one revenue target of $725,000, this tool helps you map out the path to a $1,360,000 EBITDA by year five.
You should see positive EBITDA of $89,000 in the first year, which scales significantly to $1.36 million by year five. This assumes you manage the 2.5% royalty and keep equipment costs under 8.5% while ramping up your monitoring contracts. Profit follows persistence.
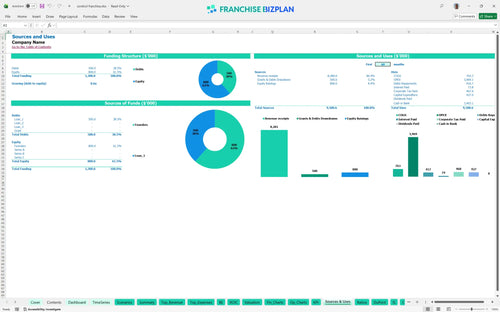
You will need roughly $427,000 to get the doors open, covering the $20,000 franchise fee and significant hardware costs. Here's the quick math: leasehold improvements and initial equipment make up over 60% of your initial cash outlay. Cash is king, but allocation is the kingdom.
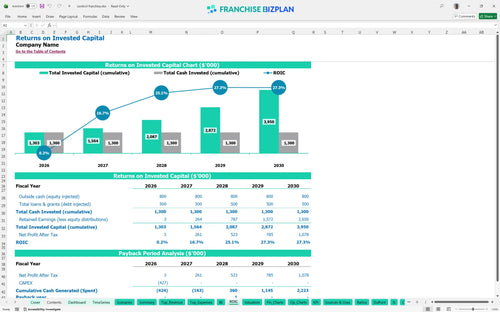
The model shows an IRR of 6.34% and a payback period of 3 years, which is solid for a service-heavy B2B model. Your return on equity (ROE) sits at 3.31 as the recurring revenue from monitoring fees begins to compound over time. Your time is the biggest investment.
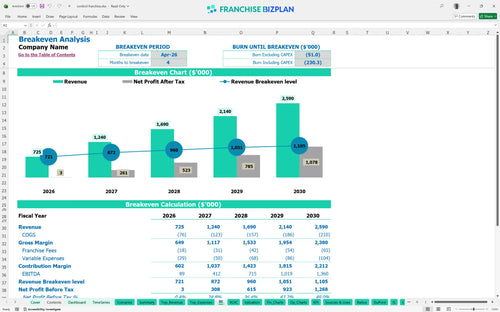
You reach the break-even date in April 2026, just four months after launching. The biggest driver here is the volume of equipment sales paired with the $6,000 monthly rent for your operations hub. Speed to break-even dictates your stress levels.
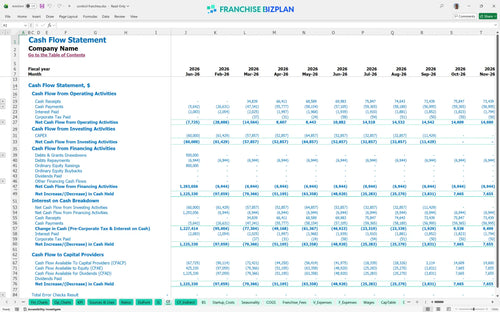
Your lowest cash point hits in September 2026 at $831,000, so you need to ensure your initial funding covers the ramp-up. Still, the recurring revenue model helps stabilize the ship once your maintenance contracts kick in. A buffer is better than a prayer.
Moving from a medium to a high-growth scenario depends heavily on your sales reps hitting their $55,000 salary-to-revenue targets. A high-performance year can push year-5 revenue well past the $2.59 million mark if local marketing execution is sharp. Scenarios are your financial headlights.
Finance: update unit break-even and payback model by Friday.
This security franchise business plan template lives in Excel, so you can tweak every number to fit your specific territory. It comes with pre-filled formulas for recurring revenue and equipment sales, but you can defintely change the assumptions as your local market shifts. Every 1-point margin leak matters fast in a high-growth service model.

Planning for the long haul is easier when you see the path from $725,000 in year one to over $2.5 million by year five. This model tracks your growth through equipment sales and monitoring fees, giving you a clear look at your potential store-level margin over half a decade. Growth is a marathon, not a sprint.

We baked in the 2.5% royalty fee so you see exactly how much goes to the franchisor from your gross sales. Since the marketing fund is currently at 0%, you can focus those dollars on local B2B lead generation in your specific tech corridor. Royalties are the price of brand power.

Launching requires a solid commercial security franchise investment, including $120,000 for hub improvements and $150,000 for inventory. This franchise startup cost calculator shows you'll hit break-even around month four if you stay on track with your installation schedule. Break-even is your first real victory.

We used real-world data to set benchmarks for things like equipment costs, which start at 8.5% of sales and drop as you scale. This helps you sanity-check your operational expense forecasting against typical B2B security service standards. Benchmarks keep your ego in check.


Simply purchase and download the financial model template, then access it instantly using Microsoft Excel or Google Sheets. No installation or technical expertise required-just open and start working.

Enter your business-specific numbers, including revenue projections, costs, and investment details. The pre-built formulas will automatically calculate financial insights, saving you time and effort.

Leverage the investor-ready format to confidently showcase your financial projections to banks, franchise representatives, or investors. Impress stakeholders with clear, data-driven insights and professional reports.

Leverage the investor-ready format to confidently present your projections to banks, franchise representatives, or investors.