
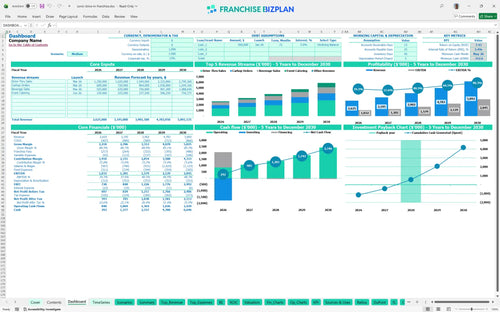
All-in-one Dashboard
Core inputs and core outputs


This comprehensive toolkit includes a fully integrated Excel workbook featuring a 5-year P&L, startup cost tracker, and automated franchise fee calculators.
Core inputs and core outputs
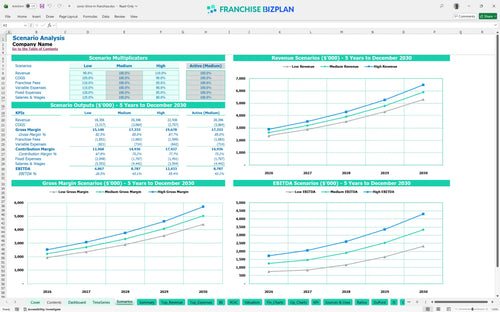
Three scenario analysis
Presentation ready
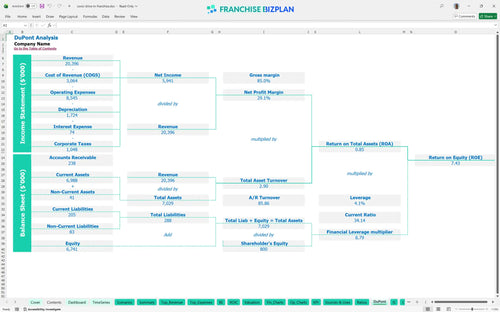
DuPont analysis
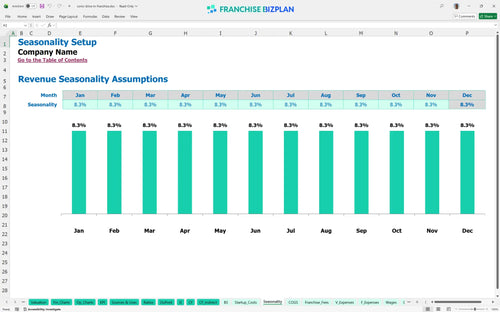
Researched revenue assumptions
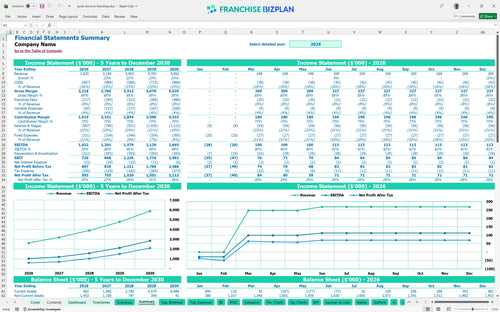
Lender-friendly financial outputs
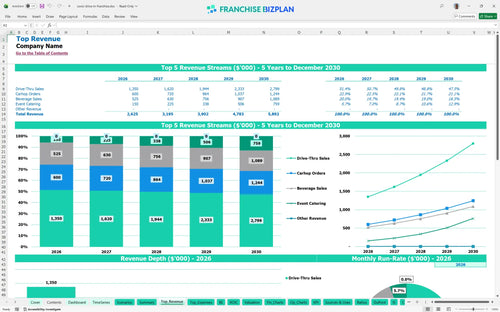
Revenue stream detailed view
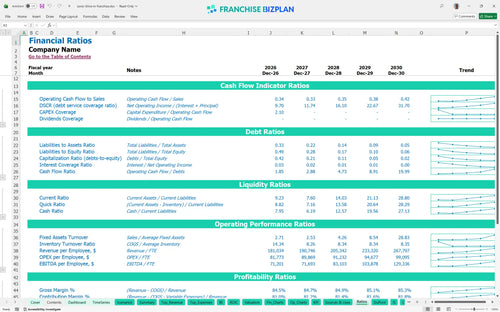
Performance metrics benchmark
We built this franchise unit financial model using our own research into the drive-in sector's unique operational needs. Key assumptions like the $45,000 initial fee, carhop staffing levels, and the $1,032,000 Year 1 EBITDA are pre-populated but fully editable. This ensures your capital expenditure planning is grounded in real-world data for this specific drive-thru concept.
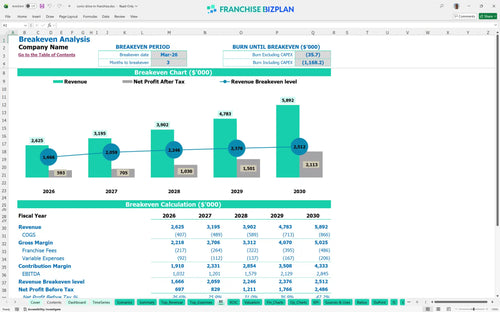
The unit reaches profitability in March 2026, just three months after opening its doors. This rapid timeline is supported by a Year 1 EBITDA of $1,032,000, provided you maintain the 14% food ingredient cost target. A detailed profitability analysis for quick-service restaurant locations shows that scaling revenue from $2.6M to $5.8M over five years significantly expands net margins.
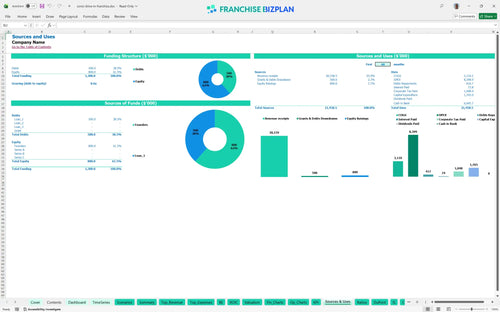
Knowing how to calculate startup costs for a drive-thru franchise is critical, and this model identifies a total need of $1,765,000. This includes the $45,000 franchise fee, $450,000 for leasehold improvements, and $300,000 for kitchen equipment. Most of the capital is deployed in the first three months to ensure the double-drive-thru and patio are ready for the March launch.
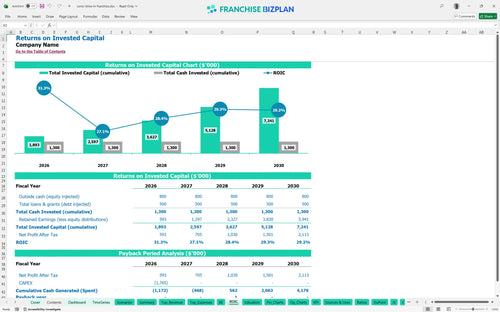
The franchise investment return on investment calculator shows a 5.44% IRR and a 7.43% ROE for this unit. With a 3-year payback period, the restaurant franchise investment analysis indicates a stable return profile, especially when considering multi-unit development projections. The Year 5 EBITDA of $2,845,000 represents a strong exit or recapitalization target for any operator.
The monthly break-even point occurs in March 2026, driven by the high-throughput double-drive-thru model. Budgeting for franchise marketing and local partnerships is essential to hit the $900,000 Year 1 drive-thru sales target. Fixed costs like the $18,000 monthly rent and $3,000 utilities require consistent daily traffic to maintain positive store-level cash flow.
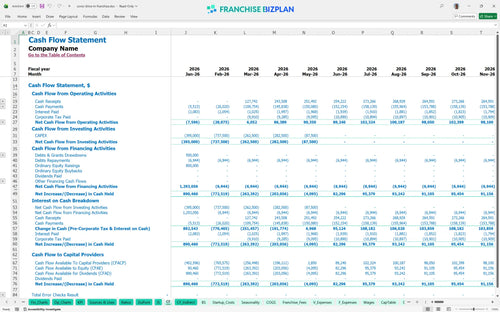
The model identifies May 2026 as the lowest cash point, with a balance of -$353,000. This dip occurs as final construction payments for the patio and outdoor furniture coincide with the initial ramp-up of carhop and kitchen staff. You should plan for a cash buffer to cover these pre-opening and early-stage operational expenses.
In a High scenario, exceeding the $900k drive-thru target could pull the payback period under 30 months. However, a Low scenario where food costs spike or catering revenue lags would defintely increase the $353,000 cash deficit. Using the model to test these scenarios helps you prepare for labor market shifts or changes in local competition.
This franchise financial model template is built in Excel, allowing you to tweak every variable from carhop wages to beverage sales growth. Use the pre-filled formulas and editable assumptions to create a franchise unit profit and loss template that mirrors your specific market conditions. It is defintely the most flexible Excel financial model template for restaurant franchisees looking for precision.

Planning for long-term growth requires more than just a fast food franchise business plan; you need a detailed 5-year outlook. This model provides full revenue, cost, and cash flow projections, including developing a P&L statement for a new franchise unit and long-term financial planning for new franchise unit development. You can see how Year 1 revenue of $2,625,000 scales to $5,892,000 by Year 5.

The model simplifies the franchise royalty fee calculation by automating the 5% royalty and 3.25% marketing fund contributions. This ensures you understand the quick-service restaurant economics of your agreement, where 8.25% of top-line sales are committed before you pay for a single burger bun. It's essential for tracking ongoing financial obligations accurately.

Before you sign a lease, you need a financial feasibility study for new restaurant locations to understand the $1,765,000 total investment. This model breaks down drive-in restaurant startup costs, including leaseholds and equipment, while identifying the exact sales volume needed to hit break-even. It's the ultimate tool for mapping your path to a 3-year payback.

Stop guessing about your margins; our model includes built-in benchmarks for estimating operating expenses for a drive-in restaurant. You can compare your 14% food cost target and $18,000 monthly rent against industry standards to ensure your operating expense forecasting stays realistic. This sanity check is vital for maintaining store-level EBITDA margins during the ramp-up phase.


Simply purchase and download the financial model template, then access it instantly using Microsoft Excel or Google Sheets. No installation or technical expertise required-just open and start working.

Enter your business-specific numbers, including revenue projections, costs, and investment details. The pre-built formulas will automatically calculate financial insights, saving you time and effort.

Leverage the investor-ready format to confidently showcase your financial projections to banks, franchise representatives, or investors. Impress stakeholders with clear, data-driven insights and professional reports.

Leverage the investor-ready format to confidently present your projections to banks, franchise representatives, or investors.