
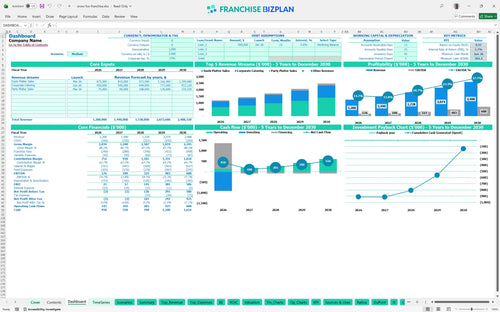
All-in-one Dashboard
Core inputs and core outputs


This Excel financial model template for food franchises includes a full suite of pro-forma statements, CAPEX schedules, and scenario toggles designed for immediate use.
Core inputs and core outputs
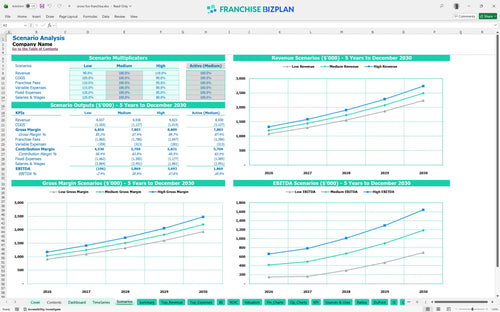
Three scenario analysis
Presentation ready
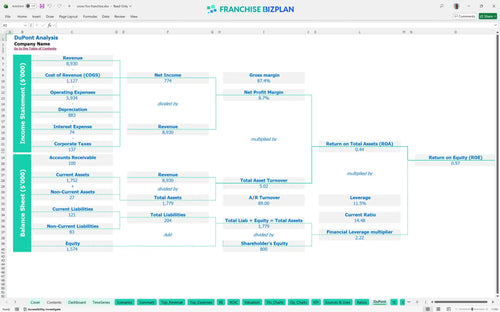
DuPont analysis
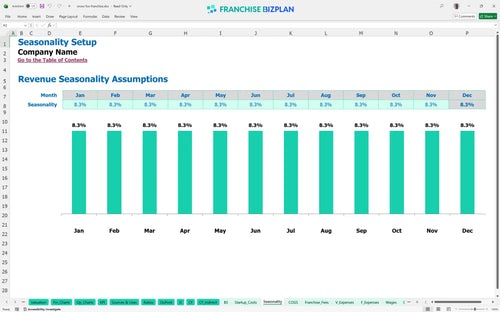
Researched revenue assumptions
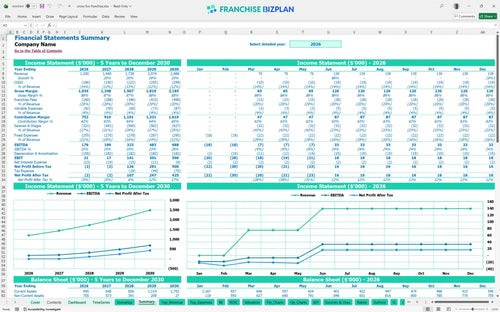
Lender-friendly financial outputs
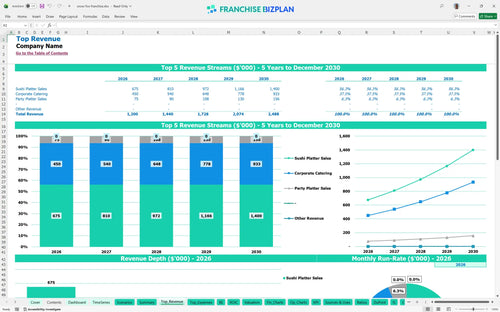
Revenue stream detailed view
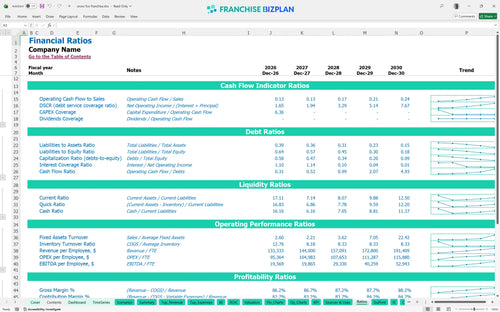
Performance metrics benchmark
We built this franchise unit financial model using our own research to reflect the specific unit economics of a premium sushi retail concept. Key assumptions like the $1.2M year-one revenue and the $16,000 monthly prime location rent are pre-populated but fully editable to match your local market conditions. This tool helps you bridge the gap between a business idea and a functional franchise unit operating expense spreadsheet.
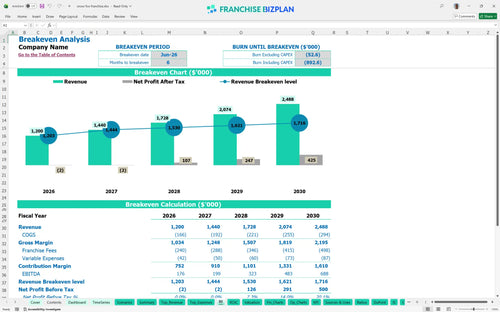
Based on the researched numbers, this unit hits its stride quickly, reaching monthly break-even by June 2026. While year-one EBITDA starts at $176,000, the real gains happen by year five as food costs drop to 10% and revenue scales toward $2.48M. Profit isn't an accident; it's a result of managing your food and labor daily.
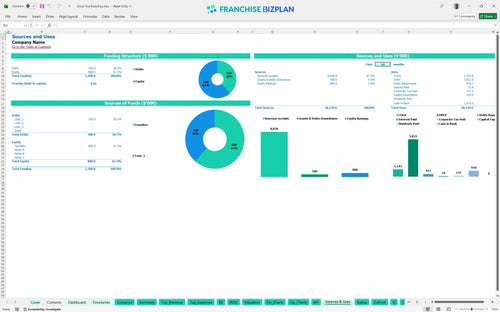
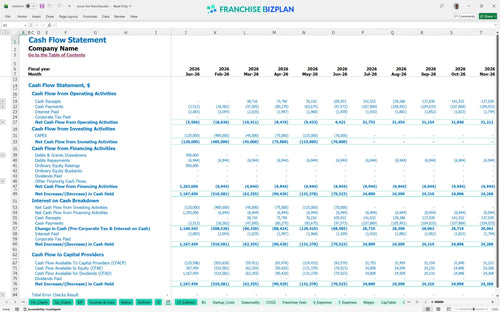
You will need approximately $910,000 in startup capital requirements to get the doors open, with a significant chunk going toward leasehold improvements and the initial franchise fee. The model also accounts for a $302,000 minimum cash requirement to handle the ramp-up phase before the June 2026 break-even point. You can't build a kitchen on a handshake; you need a plan.
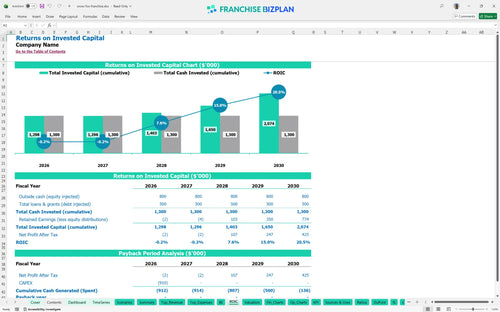
This is a long-term play with a payback period extending past the five-year mark and an IRR of 1.72%. While the ROE stands at 0.97, the value lies in the steady climb of EBITDA, which nearly quadruples between year one and year five. Patience is a virtue, especially with a five-year-plus payback window.
The unit hits its break-even point in month 6, specifically June 2026. The biggest hurdle to reaching this is the high 20% royalty burden and the $16,000 monthly rent, which require high throughput from the sushi platter and catering revenue streams. Break-even is your first real victory in the franchise world.
Your lowest cash point occurs in June 2026, with a minimum cash balance of $302,000. You need enough working capital to survive the first six months of operations while the theatrical kitchen concept builds its local following and loyalty app users. Running out of cash is the only way to truly fail.
Profitability analysis for retail sushi franchise locations shows that a 10% drop in revenue can push the payback period out significantly due to high fixed costs. Conversely, hitting the high-growth scenario moves the $688,000 EBITDA target forward, drastically improving the ROI calculation for franchises. Scenarios help you prepare for the worst while you work for the best.
Finance: update unit break-even and payback model by Friday.
This franchise unit financial model template is built in Excel, meaning you can tweak every assumption to fit your specific territory. Whether you are adjusting for local labor rates or specific lease terms, the pre-filled formulas handle the heavy lifting. It is a flexible tool designed to turn what-ifs into a concrete restaurant business plan template that banks and investors actually trust.

We modeled a 5-year trajectory where revenue climbs from $1.2M in year one to over $2.4M by year five. This food service financial forecasting tool tracks how scaling from 2 to 4 sushi chefs impacts your bottom line as volume grows. Knowing your numbers over five years is the difference between a guess and a goal.

Operating a franchise means managing top-line haircuts before you even pay rent. This model accounts for a 20% royalty fee and the initial $100,000 entry cost, ensuring your franchise profitability analysis is grounded in reality. It defintely helps to see exactly how these fees eat into your $16,000 monthly rent budget and overall store-level margin.

Launching this unit requires a significant $910,000 in startup capital, covering everything from $450,000 in leasehold improvements to $180,000 in specialized sushi cases. Our franchise investment feasibility tool identifies the exact sales volume needed to cover these fixed costs. Cash is the oxygen of a new restaurant, and this analysis keeps you breathing.

Don't guess if your 12% food cost is competitive. The model includes built-in benchmarks to help with estimating labor and food costs for franchise units, ensuring your projections stay within industry norms. Benchmarking is how you know if your chefs are working for you or against you.


Simply purchase and download the financial model template, then access it instantly using Microsoft Excel or Google Sheets. No installation or technical expertise required-just open and start working.

Enter your business-specific numbers, including revenue projections, costs, and investment details. The pre-built formulas will automatically calculate financial insights, saving you time and effort.

Leverage the investor-ready format to confidently showcase your financial projections to banks, franchise representatives, or investors. Impress stakeholders with clear, data-driven insights and professional reports.

Leverage the investor-ready format to confidently present your projections to banks, franchise representatives, or investors.