
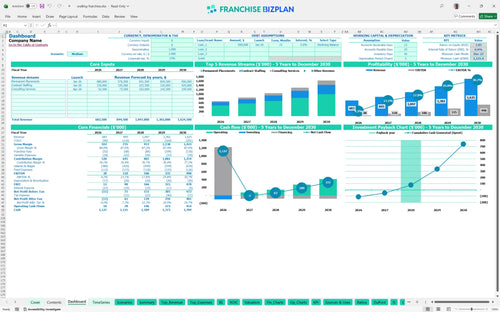
All-in-one Dashboard
Core inputs and core outputs


This Excel financial model for new franchise unit operations provides a complete framework for projecting permanent placement fees, contract staffing markups, and multi-year recruiter payroll scaling.
Core inputs and core outputs
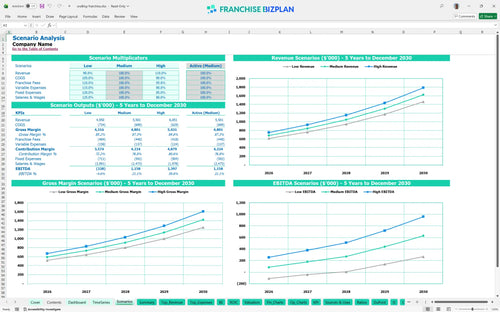
Three scenario analysis
Presentation ready
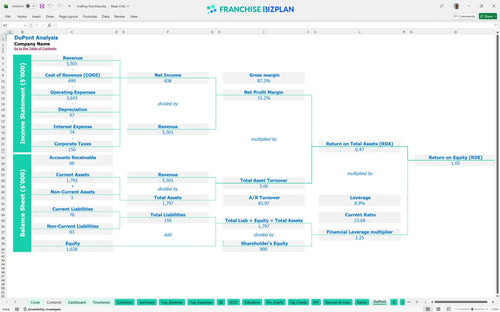
DuPont analysis
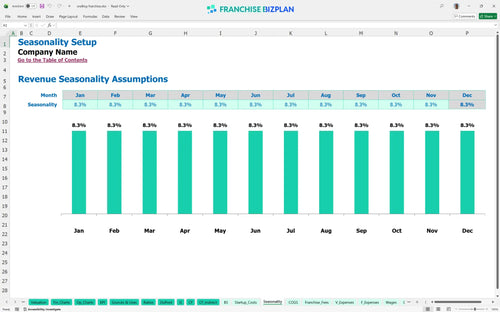
Researched revenue assumptions
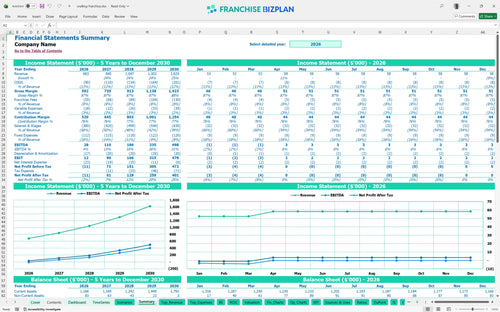
Lender-friendly financial outputs
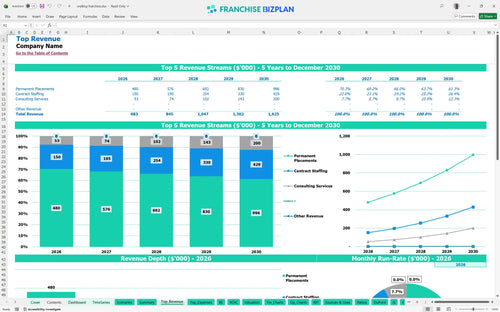
Revenue stream detailed view
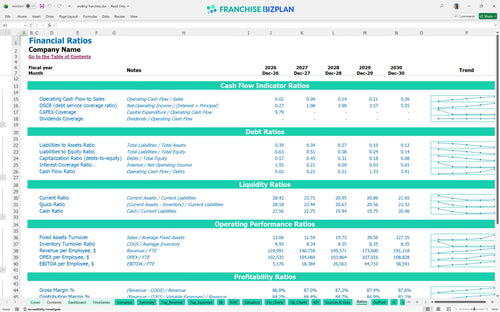
Performance metrics benchmark
We developed this franchise unit financial model based on detailed research into professional staffing overhead and revenue cycles. Key assumptions, including the $320,000 Year 1 permanent placement forecast and $1,500 monthly AI software subscription, are pre-populated and fully editable to match your specific market conditions. This data-driven approach ensures your financial planning for service-based franchise startup is both accurate and professional.
The unit reaches EBITDA positivity in Year 1 with $28,000, scaling to $498,000 by Year 5 as the recruiter headcount grows. Profitability is driven by the expansion of contract staffing revenue and maintaining a tight 8% royalty burden on gross billings.
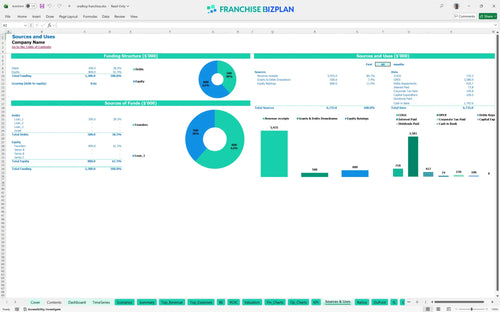
To launch and ramp up this unit, you need to plan for a minimum cash requirement of $1,121,000 by late 2027. This covers the $2,500 franchise fee, $25,000 in leasehold improvements, and $28,000 for AI software implementation to ensure rapid candidate matching.
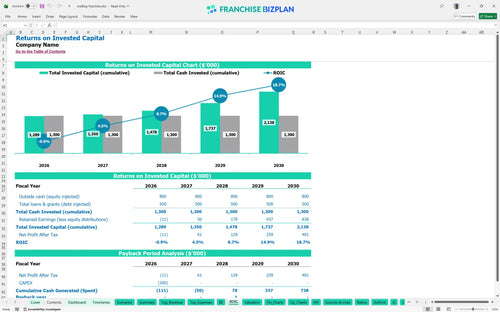
Investors can expect an Internal Rate of Return (IRR) of 6.58% and a Return on Equity (ROE) of 1.05. The payback period is estimated at 3 years, reflecting the time needed to scale the recruiter team and mature the contract staffing pipeline.
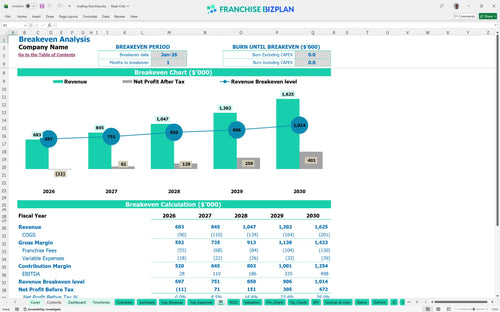
The unit is projected to reach break-even in January 2026, just one month after launch, assuming the initial placement pipeline is ready. The primary driver for this quick break-even is the low initial variable cost structure and immediate demand for permanent placements.
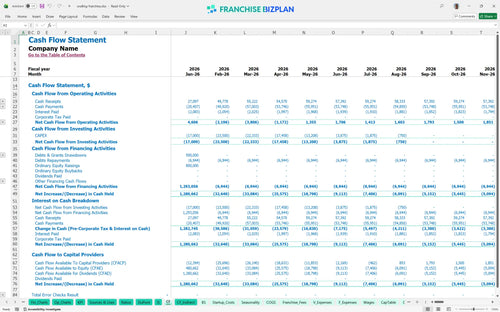
Your lowest cash point defintely occurs in December 2027 at $1,121,000 due to the working capital requirements of contract staffing. You will need a significant cash buffer to fund contractor payments before client invoices are settled during the high-growth phase.
In a High scenario, increasing consulting services above the $35,000 base significantly improves the Year 1 margin. Conversely, a Low scenario with slower recruiter productivity will delay the 3-year payback and increase the peak cash need during the ramp-up period.
Finance: update unit break-even and payback model by Friday.
This staffing franchise financial model is built in Excel with fully editable assumptions, allowing you to adjust every driver from recruiter commissions to local office rent. Pre-filled formulas ensure that when you change a hiring timeline or a placement fee percentage, the entire five-year outlook updates automatically to reflect your specific territory.

Plan your long-term growth with a recruitment franchise business plan that projects performance from your first placement through five years of scaling. The model tracks how Year 1 revenue of $683,000 matures into a $1,625,000 operation, giving you a clear view of future cash flow and net profit margins.

This tool simplifies franchise unit profitability analysis by automating the calculation of your 8% royalty fee against all revenue streams. By factoring in these ongoing obligations alongside the initial $2,500 franchise fee, you get a realistic picture of the cash remaining for local operations and owner draws.

Use this staffing agency profit calculator to determine exactly how much capital you need for leasehold improvements, furniture, and AI software implementation. The model identifies your break-even sales volume, helping you understand the number of permanent placements required each month to cover your $5,500 rent and core payroll.

The model includes researched benchmarks for recruitment agency overhead, such as contractor payments starting at 12% of revenue and candidate screening costs. These built-in metrics allow you to sanity-check your projections against industry standards for a service-based franchise startup to ensure your plan is grounded in reality.


Simply purchase and download the financial model template, then access it instantly using Microsoft Excel or Google Sheets. No installation or technical expertise required-just open and start working.

Enter your business-specific numbers, including revenue projections, costs, and investment details. The pre-built formulas will automatically calculate financial insights, saving you time and effort.

Leverage the investor-ready format to confidently showcase your financial projections to banks, franchise representatives, or investors. Impress stakeholders with clear, data-driven insights and professional reports.

Leverage the investor-ready format to confidently present your projections to banks, franchise representatives, or investors.