
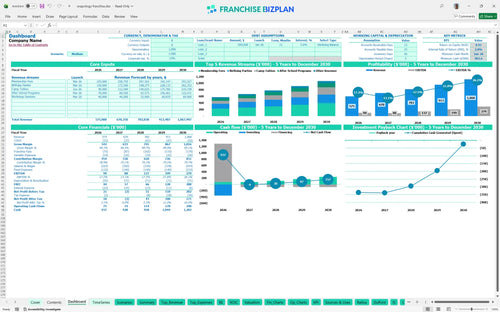
All-in-one Dashboard
Core inputs and core outputs


This comprehensive toolkit provides a professional-grade P&L, cash flow statement, and automated dashboard designed specifically for a STEAM education unit.
Core inputs and core outputs
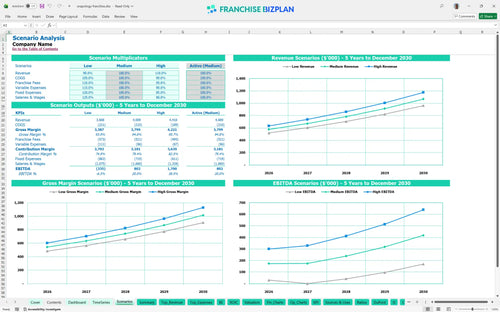
Three scenario analysis
Presentation ready
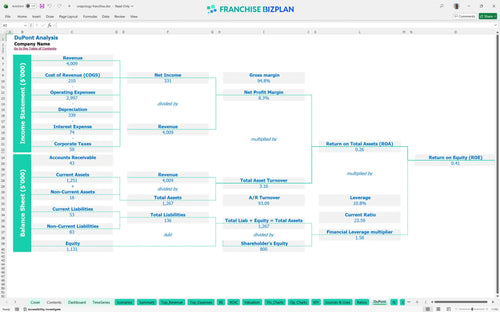
DuPont analysis
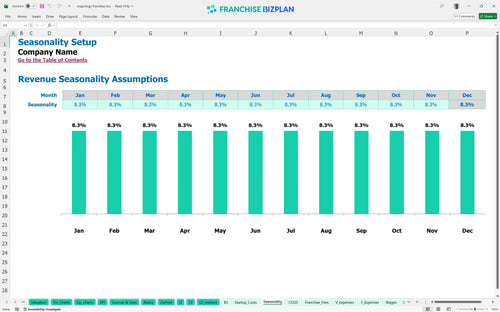
Researched revenue assumptions
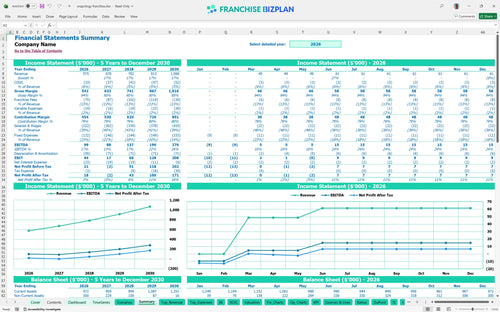
Lender-friendly financial outputs
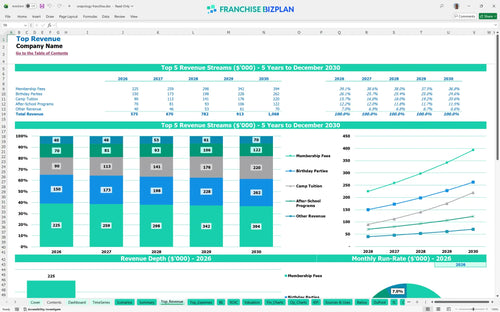
Revenue stream detailed view
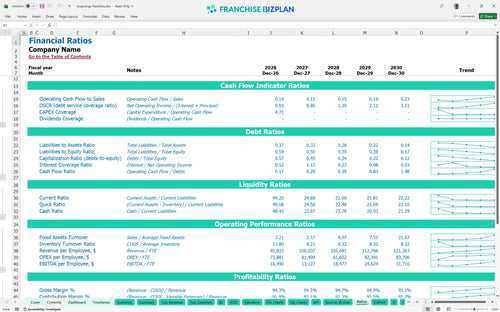
Performance metrics benchmark
We built this children's education franchise business plan model using detailed research into the enrichment sector. All key assumptions, including the $575,000 year-one revenue target and 7% royalty fees, are pre-populated for a Snapology Franchise franchise unit but remain fully editable for your specific market. Real-world data beats a best-guess every time.
Based on the educational franchise P&L statement, this unit is projected to turn an EBITDA profit of $99,000 in its first year. While year two shows a slight dip to $88,000 as staff scales, profitability grows defintely toward $279,000 by year five as enrollment matures. Year one starts with a $99,000 EBITDA floor.
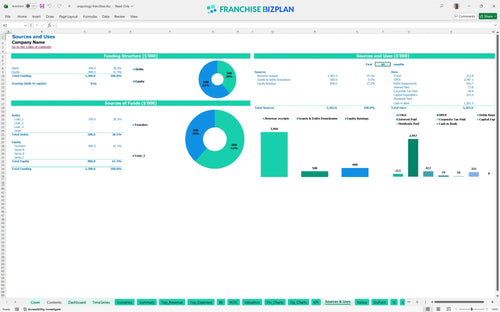
To learn how to calculate startup costs for a kids STEAM franchise, you must look at the $355,000 in primary capital outlays. This includes the $40,000 franchise fee, $120,000 for leasehold improvements, and $90,000 for robotics lab equipment to outfit the discovery center. You'll need about $355,000 just to get the doors open.
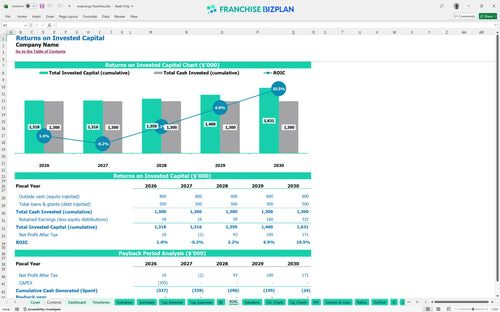
When calculating ROI for STEAM education franchise investment, the model shows an IRR of 2.01% and a return on equity of 0.41. Because of the significant upfront equipment and build-out costs, full payback of the initial investment occurs after year five. This is a long-term play, not a quick flip.
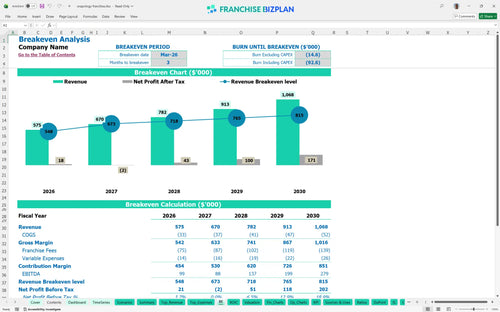
The model shows a fast path to operational stability with a breakeven date in March 2026, just three months after launch. Achieving this depends on managing your children's activity center operations efficiently, specifically balancing the $8,000 monthly rent against your $150,000 membership fee revenue. You only need three months to stop the bleeding.
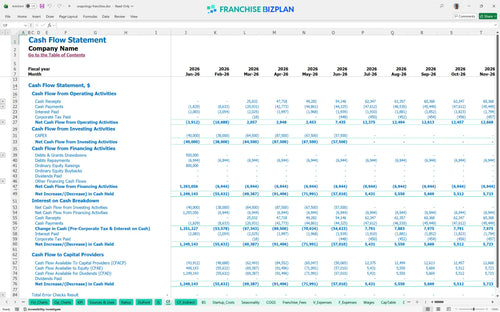
According to this financial planning guide for new franchise owners, your lowest cash point occurs in June 2026 at $904,000. You need to ensure you have enough liquidity to handle the initial ramp-up and equipment payments before the high-volume summer camp season kicks in. Keep $904,000 ready to handle the Jun-26 cash dip.
Analyzing unit economics for children's recreation businesses shows that a high-performance scenario significantly pulls forward your ROI. If you hit the high-case revenue targets through better local marketing, your year-five EBITDA can exceed the $279,000 baseline, while a low-case scenario may extend the payback period further. A 10% swing in enrollment changes everything.
Finance: update unit break-even and payback model by Friday.
This franchise financial model template is fully customizable in Excel, allowing you to manualy adjust every assumption to fit your specific territory. You can tweak pre-filled formulas for revenue and costs, making it simple to adapt the model for a mobile-only setup or a full-scale retail discovery center. Every cell is open for your specific local data.

Plan for long-term growth with a detailed STEAM learning center financial forecast that spans sixty months of operations. The model tracks the transition from a $575,000 year-one revenue base to over $1 million by year five, helping you visualize the scaling process and long-term cash flow health. Five years of data helps you see past the initial struggle.

This tool simplifies the supplemental education business model by accounting for every franchisor obligation, from the initial $40,000 fee to ongoing costs. It automatically calculates the 7% royalty and 6% marketing fund contribution against your monthly gross sales so you see the true net margin. Don't let the 13% total fee load surprise you.

Use this franchise startup cost calculator to map out your total initial investment, including the $120,000 leasehold improvements and $90,000 in robotics lab equipment. The model identifies the exact sales volume needed to cover your $8,000 monthly rent and payroll, ensuring you know your survival numbers from day one. Knowing your floor is the only way to sleep at night.

Our kids enrichment franchise profitability analysis includes built-in benchmarks to help you sanity-check your labor and occupancy costs. By comparing your projected $60,000 director salary and instructor wages against industry averages, you can ensure your margins stay competitive within the enrichment sector. Comparing your rent to the average keeps you honest.


Simply purchase and download the financial model template, then access it instantly using Microsoft Excel or Google Sheets. No installation or technical expertise required-just open and start working.

Enter your business-specific numbers, including revenue projections, costs, and investment details. The pre-built formulas will automatically calculate financial insights, saving you time and effort.

Leverage the investor-ready format to confidently showcase your financial projections to banks, franchise representatives, or investors. Impress stakeholders with clear, data-driven insights and professional reports.

Leverage the investor-ready format to confidently present your projections to banks, franchise representatives, or investors.