
All-in-one Dashboard
Core inputs and core outputs


This Excel template for smoothie franchise financial forecasting provides a complete toolkit for modeling unit-level profitability, cash flow, and multi-unit expansion scenarios.
Core inputs and core outputs
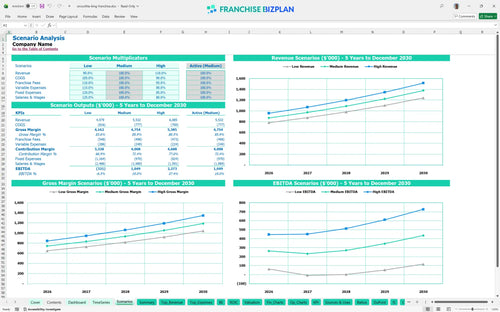
Three scenario analysis
Presentation ready
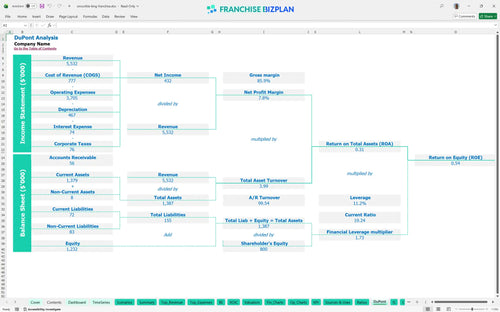
DuPont analysis
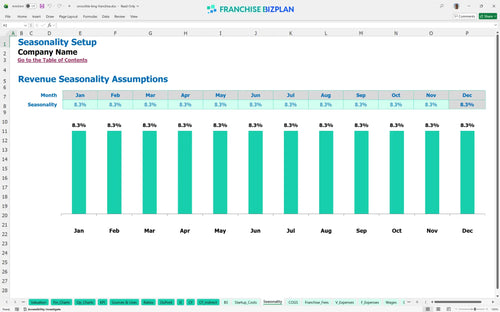
Researched revenue assumptions
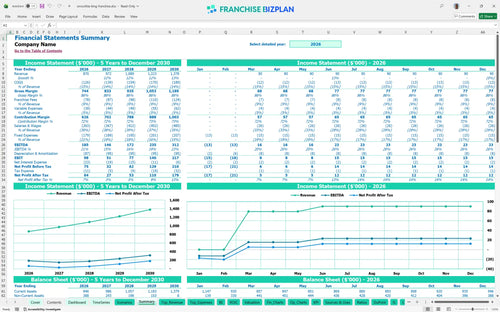
Lender-friendly financial outputs
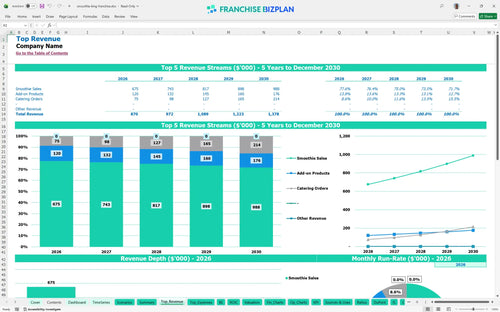
Revenue stream detailed view
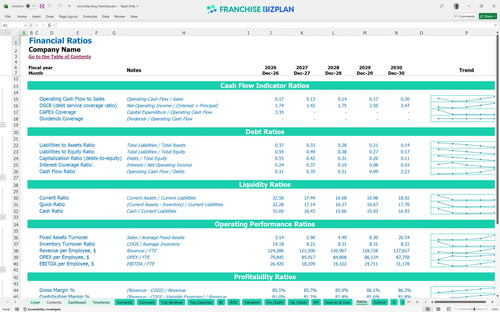
Performance metrics benchmark
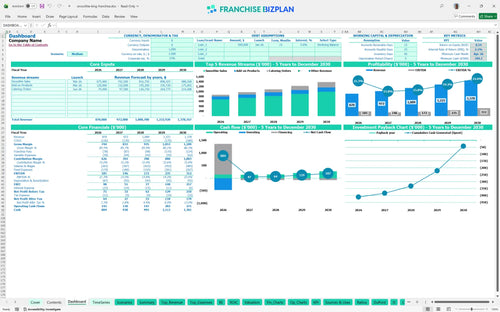
We built this franchise unit financial model using our own research into the healthy beverage sector to ensure the numbers reflect actual store-level realities. Key assumptions like the $870,000 year-one revenue and the specific 9% total fee structure are pre-populated and fully editable to match your specific territory. This model helps you move past the marketing fluff and look at the actual cash flow potential of a new location.
The unit shows positive EBITDA of $185,000 in the first year, but true bottom-line proftability depends on managing the 14.5% combined cost of ingredients and packaging. While the store generates cash quickly, the heavy initial investment means you are playing a long game for total recovery.
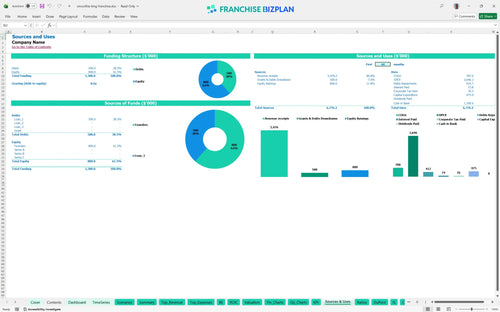
You will need significant capital to get the doors open, with the total investment driven by leasehold improvements and specialized kitchen equipment. The model accounts for a $30,000 franchise fee and roughly $475,000 in total CAPEX to ensure the store meets brand standards from day one.
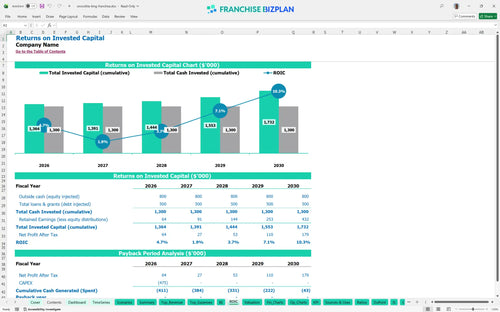
The internal rate of return (IRR) sits at 2.1%, which reflects a stable but capital-intensive business model where the payback period extends beyond the five-year mark. This is a long-term equity play, as shown by the 0.54 return on equity, making it better suited for operators focused on steady cash flow rather than a quick exit.
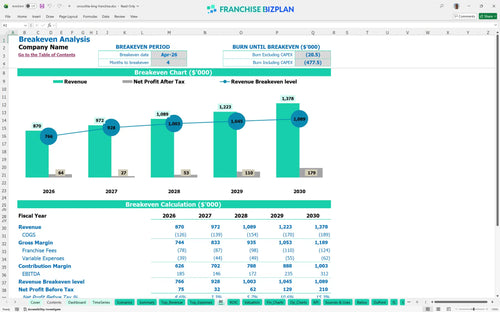
The unit reaches its monthly break-even point in April 2026, just four months after the projected launch, provided you hit the $870,000 annual revenue target. The biggest hurdle to break-even is the $11,000 monthly rent, which requires high daily throughput to offset the fixed occupancy cost.
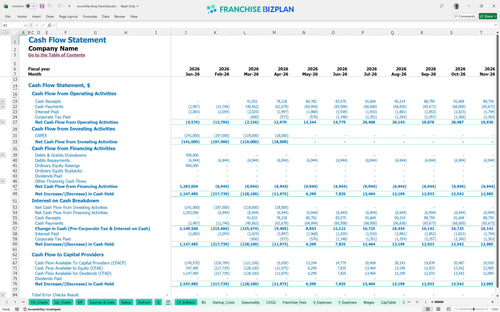
The lowest cash point occurs in April 2026, with a minimum cash balance of $790,000 projected after all startup costs and initial ramp-up losses are accounted for. You need a solid working capital buffer to handle the months between signing the lease and reaching full trading capacity.
The model scales from a $870,000 base in year one to $1.378 million in year five, showing how high-performance scenarios significantly accelerate the 2.1% IRR. A high-performing unit in a prime medical district can reach peak EBITDA much faster than a standard suburban location.
This franchise financial model template is built entirely in Excel, giving you the flexibility to swap out any assumption as your local market data changes. It uses pre-filled formulas and editable inputs so you can test different rent prices, labor rates, or product mixes without breaking the math. It is defintely the most efficient way to turn a vague business idea into a concrete proftability analysis.

Planning for a single location is one thing, but this franchise financial projection spreadsheet looks five years into the future to help you see the horizon. You can track how annual revenue grows from $870,000 in year one to over $1.3 million by year five, allowing for better capital expenditure planning. It provides a full view of your long-term profit and loss, cash flow, and balance sheet health.

The real cost of a franchise isn't just the build-out; it is the recurring fees that eat into your store-level margin every month. This model incorporates FDD financial disclosure data to automate the calculation of the 6% royalty and 3% marketing fund contributions. By mapping these out early, you can see exactly how much cash stays in your pocket after the franchisor takes their cut.

Using a franchise startup cost calculator is the only way to avoid running out of cash before the grand opening. This tool helps you estimate the total initial investment, from the $30,000 franchise fee to the $200,000 needed for leasehold improvements. It also includes a step by step guide to franchise financial projections so you know exactly when your sales volume will finally cover your monthly bills.

We have baked in franchise unit economics and industry benchmarks to help you sanity-check your expectations against real-world performance. Whether you are looking at labor costs for your crew or the $11,000 monthly rent for a prime location, these benchmarks act as a guardrail. It is the best financial planning tools for new franchise owners who want to avoid overly optimistic projections.


Simply purchase and download the financial model template, then access it instantly using Microsoft Excel or Google Sheets. No installation or technical expertise required-just open and start working.

Enter your business-specific numbers, including revenue projections, costs, and investment details. The pre-built formulas will automatically calculate financial insights, saving you time and effort.

Leverage the investor-ready format to confidently showcase your financial projections to banks, franchise representatives, or investors. Impress stakeholders with clear, data-driven insights and professional reports.

Leverage the investor-ready format to confidently present your projections to banks, franchise representatives, or investors.