
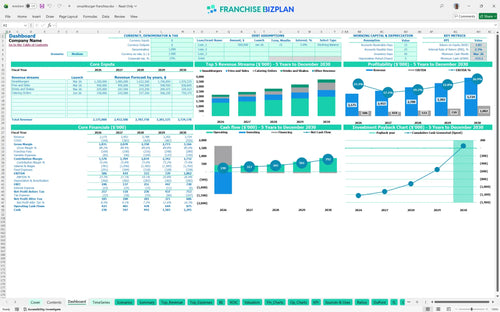
All-in-one Dashboard
Core inputs and core outputs


This Excel template for restaurant franchise financial projections provides a data-driven roadmap for projecting revenue, managing expenses, and calculating the total return on investment for a high-volume burger location.
Core inputs and core outputs
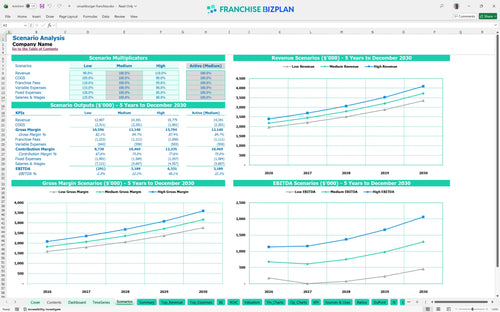
Three scenario analysis
Presentation ready
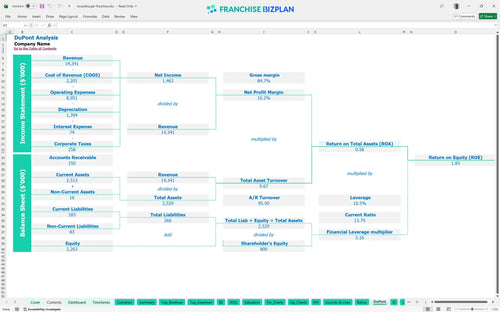
DuPont analysis
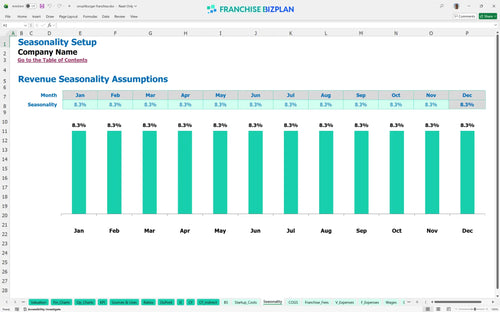
Researched revenue assumptions
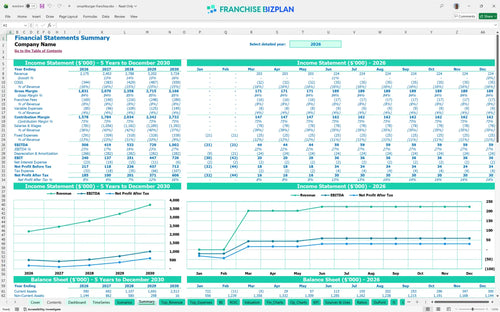
Lender-friendly financial outputs
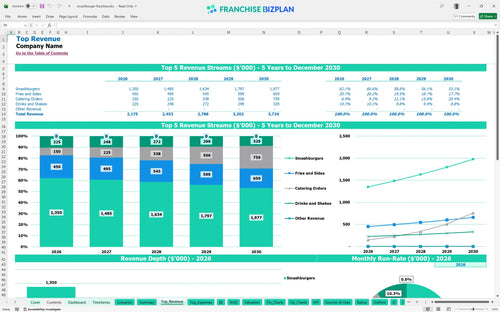
Revenue stream detailed view
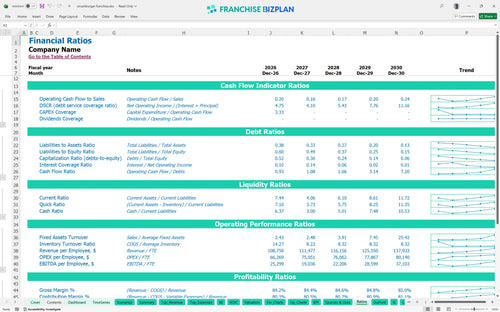
Performance metrics benchmark
We built this franchise unit profitability analysis using deep research into the fast-casual burger sector. Key assumptions, including a $1.41 million total investment and a 5.5% royalty fee, are pre-populated with researched data specific to this burger franchise unit and are fully editable. This tool helps you visualize how the $2.175 million year-one revenue scales into a $1.002 million EBITDA by year five.
This unit is projected to reach profitability in its first year, generating an initial EBITDA of $506,000. While the first three months involve a ramp-up, the model shows how to project revenue for a new franchise unit as catering orders scale from $150,000 to over $750,000 by year five.
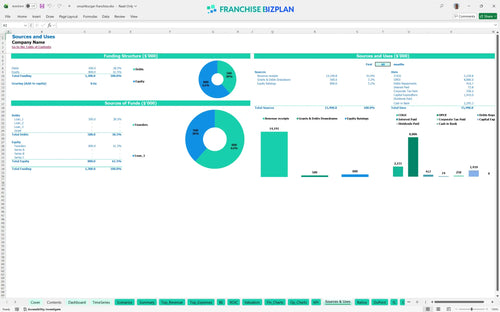
You will need approximately $1.41 million to launch this unit, covering the franchise fee, build-out, and essential kitchen equipment. This total includes a $650,000 allocation for leasehold improvements and $400,000 for capital expenditure on specialized grills and fryers.
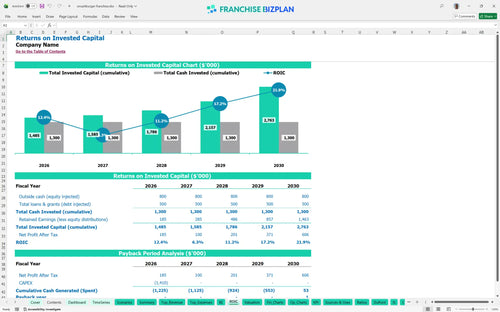
You can expect a 2.29% Internal Rate of Return (IRR) and a full payback on your initial investment within 5 years. This ROI calculation accounts for the high initial build-out costs while projecting a $1.002 million EBITDA by the end of year five.
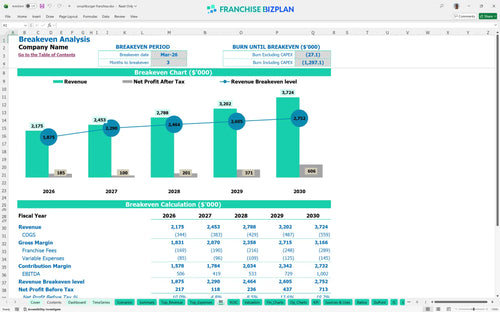
The unit reaches its break-even point in March 2026, just 3 months after opening. To cover the $25,000 in monthly fixed costs, including the $18,000 rent, you must maintain a consistent daily ticket volume across all menu categories.
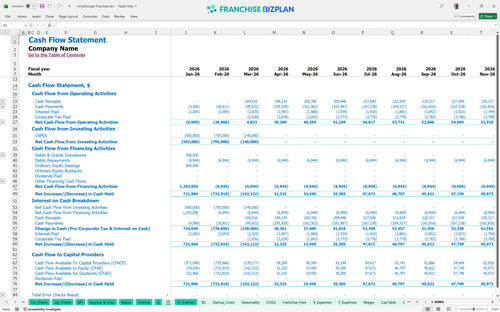
The lowest cash point is negative $153,000, occurring in March 2026 during the initial ramp-up. You should defintely secure a working capital buffer to handle this 3-month gap before the unit becomes self-sustaining.
Toggling between scenarios shows that a 10% revenue increase can significantly shorten your 5-year payback period. Calculating profitability for a fast casual dining location requires testing these Low, Medium, and High cases to protect your store-level margin.
Finance: update unit break-even and payback model by Friday.
This franchise financial model template is built in Excel to give you total control over your unit's future. You can adjust every driver, from the number of burgers sold to the hourly rate for cooks, ensuring the math fits your specific market. It is a flexible tool designed for fast casual restaurant financial model planning where local operating expenses often deviate from national averages.

Long-term viability requires looking past the grand opening to see how the bottom line evolves as catering and delivery scale. This pro forma income statement tracks your journey from a $2.175 million year-one revenue base to a projected $3.724 million by year five. By following best practices for franchise unit financial forecasting, you can see how margin expansion happens as fixed costs like the $18,000 monthly rent become a smaller percentage of total sales.

Operating under a brand name comes with fixed obligations that impact your store-level margin. This model accounts for the 5.5% royalty fee and 2.25% marketing fee taken right off the top of your gross sales. Understanding these outflows is vital for any restaurant franchise business plan or financial planning for burger restaurant franchises, as they represent a permanent $168,000+ annual expense at year-one volumes.

You need a clear view of when the business stops burning cash and starts generating it. This franchise startup cost calculator and break-even analysis totals your initial $1.41 million investment, including the $650,000 build-out and $400,000 in kitchen equipment. We show you exactly how to calculate startup costs for a burger franchise so you know the sales level required to cover your $25,000 in monthly fixed expenses.

We integrated realistic standards for food costs and labor to keep your projections grounded in reality. For instance, food ingredients are modeled at 14% of sales, which is a key component of analyzing franchise unit performance metrics. This financial model template for restaurant franchise owners helps you identify if your restaurant franchise operating cost breakdown-including a $85,000 store manager-is aligned with estimating labor and food costs for franchise businesses.


Simply purchase and download the financial model template, then access it instantly using Microsoft Excel or Google Sheets. No installation or technical expertise required-just open and start working.

Enter your business-specific numbers, including revenue projections, costs, and investment details. The pre-built formulas will automatically calculate financial insights, saving you time and effort.

Leverage the investor-ready format to confidently showcase your financial projections to banks, franchise representatives, or investors. Impress stakeholders with clear, data-driven insights and professional reports.

Leverage the investor-ready format to confidently present your projections to banks, franchise representatives, or investors.