


All-in-one Dashboard
Core inputs and core outputs



This Excel-based tool provides a complete framework for estimating ROI for waste management franchises and managing unit-level performance.
Core inputs and core outputs
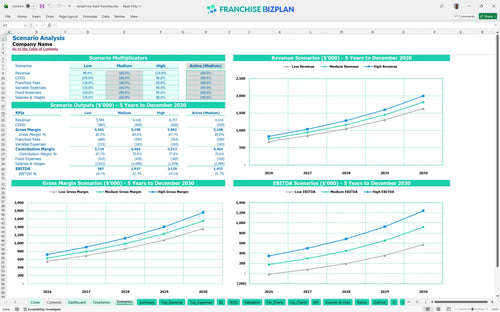
Three scenario analysis

Presentation ready

DuPont analysis
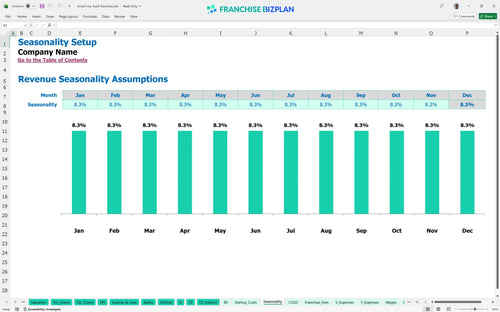
Researched revenue assumptions
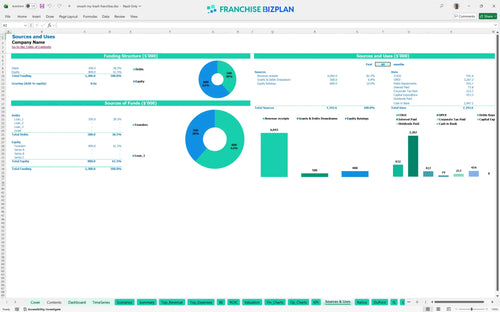
Lender-friendly financial outputs
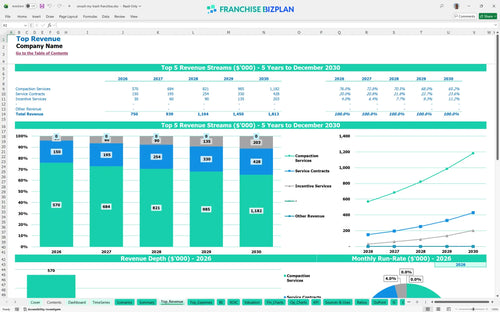
Revenue stream detailed view

Performance metrics benchmark
We built this franchise unit financial model using our own research into this waste management franchise opportunity. Key assumptions, including the $380,000 first-year compaction revenue and the operational expense breakdown for waste franchises, are pre-populated and fully editable. This mobile waste compaction business plan template helps you track the path from initial setup to a projected $753,000 EBITDA in Year 5.
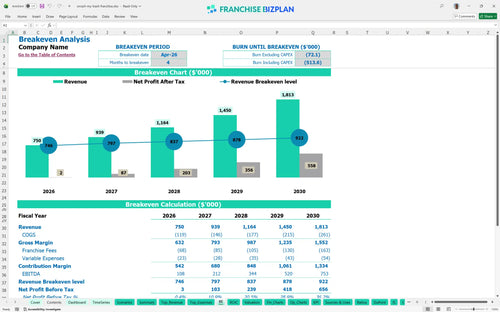
This unit is projected to reach its monthly break-even point in April 2026, just four months after launching operations. By calculating net profit after the 8% royalty, 1% marketing fee, and significant labor costs for five operators, the model shows a Year 1 EBITDA of $108,000. Learning how to calculate franchise unit profitability is easier when you see the ramp-up from $750,000 in Year 1 revenue to $1.16 million by Year 3.
Launching this unit requires a significant initial investment, primarily driven by the $285,000 compaction truck purchase and the $49,500 franchise fee. When you include the $28,000 base fitout and $18,000 digital setup, the total startup costs for industrial service franchises can be substantial. The model suggests a minimum cash reserve of $746,000 to maintain a safe runway through the May 2026 low point.
Franchisees can expect a project Internal Rate of Return (IRR) of 3.61% and a Return on Equity (ROE) of 1.51 based on the 5-year outlook. The payback period is estimated at 4 years, which is typical for a capital-intensive sustainability business model. While Year 1 margins are tighter due to setup costs, the average net margin improves as the service contract revenue scales from $100,000 to over $285,000.

The monthly break-even point occurs in month 4, requiring enough service volume to cover $6,000+ in monthly fixed expenses and the 9% total franchise fee burden. Financial modeling for mobile service businesses shows that labor is the biggest variable; with five operators and an operations manager, payroll is the primary lever. B2B franchise revenue forecasting methods suggest that securing three large service contracts early can pull this date forward.
The lowest cash point is defintely May 2026, where the minimum cash balance hits $746,000 during the initial ramp-up. You need roughly six months of runway to handle the gap between the $285,000 truck purchase and the steady collection of recurring service fees. A cash buffer is recommended to handle the 11% fuel cost volatility and any delays in B2B payment processing fees.

Franchise financial forecasting for startups must account for volume fluctuations in the industrial sector. In a high-growth scenario where compaction services exceed $380,000 in Year 1, the payback period can drop below 4 years. Conversely, the low case shows that a 15% dip in service contracts puts pressure on the $746,000 cash floor. Using the best excel templates for franchise unit modeling lets you stress-test these variables before signing a lease.
This franchise financial model template is fully customizable in Excel, featuring pre-filled formulas and editable assumptions that adapt to your specific territory. You can modify the mobile service business financial plan to account for local fuel prices, varying labor rates, and specific B2B contract terms without breaking the underlying logic.

Plan for long-term growth with detailed 5-year revenue, cost, and cash flow projections designed for a multi-unit or single-unit operator. This tool supports capital expenditure planning by mapping out the impact of adding compaction trucks as your revenue grows from $750,000 in Year 1 to over $1.8 million by Year 5. ROI forecasting is built into every sheet to track your progress toward a mature EBITDA margin.

Analyzing franchise royalty and fee structures is essential to protect your store-level margin. The model tracks the 8% royalty and 1% marketing fund contributions against your gross sales, ensuring you see the impact of franchise operational expenses on your bottom line. It also accounts for the initial $49,500 franchise fee as part of your Day 1 capital requirements.

Estimate your total franchise unit startup costs with precision, including the $285,000 truck purchase and $28,000 base fitout. The model provides a clear break-even sales estimate, showing you the exact volume of 'smashes' required each month to cover your fixed costs like the $2,800 monthly rent and $1,450 fleet insurance.

This franchise profitability analysis incorporates industry-specific benchmarks for industrial waste reduction services. You can sanity-check your assumptions for diesel fuel (projected at 11% of sales) and equipment parts (4.8%) against typical ranges to ensure your financial plan remains grounded in operational reality.


Simply purchase and download the financial model template, then access it instantly using Microsoft Excel or Google Sheets. No installation or technical expertise required-just open and start working.

Enter your business-specific numbers, including revenue projections, costs, and investment details. The pre-built formulas will automatically calculate financial insights, saving you time and effort.

Leverage the investor-ready format to confidently showcase your financial projections to banks, franchise representatives, or investors. Impress stakeholders with clear, data-driven insights and professional reports.

Leverage the investor-ready format to confidently present your projections to banks, franchise representatives, or investors.