
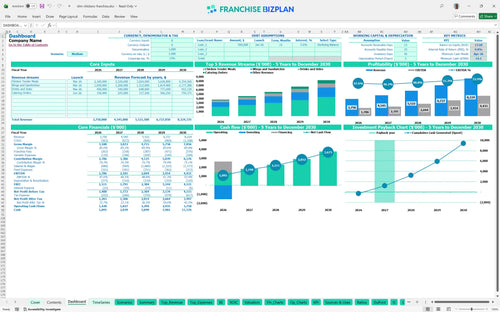
All-in-one Dashboard
Core inputs and core outputs


This franchise unit financial model includes a comprehensive P&L, cash flow projection, and CAPEX schedule designed to help you build a financial model for a restaurant franchise with precision.
Core inputs and core outputs
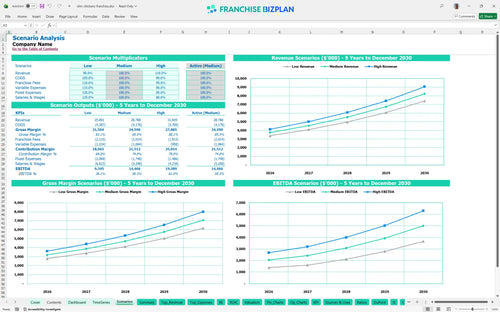
Three scenario analysis
Presentation ready
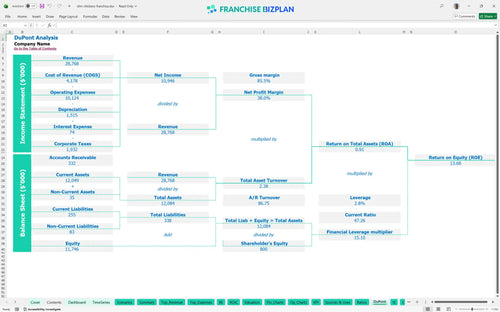
DuPont analysis
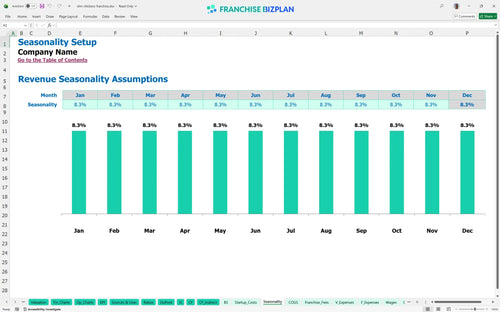
Researched revenue assumptions
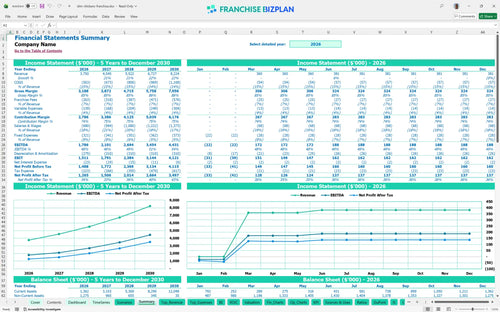
Lender-friendly financial outputs
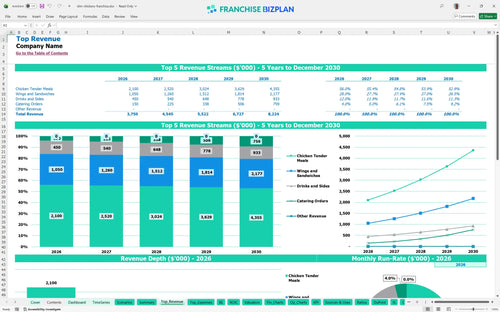
Revenue stream detailed view
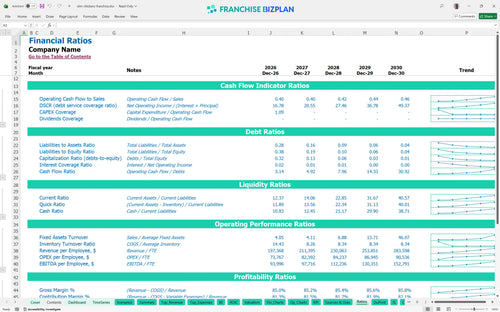
Performance metrics benchmark
We built this franchise unit financial model using our own research to ensure it reflects the day-to-day realities of this chicken concept. Key assumptions like the $3.75M year-one revenue and 5% royalty fees are pre-populated and fully editable to match your specific location. This researched data gives you a head start on your restaurant franchise business plan and financial projections.
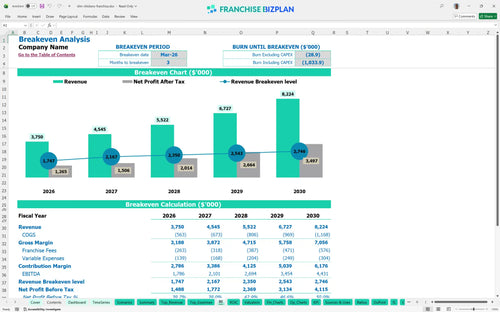
This unit becomes profitable quickly, with the model projecting a break-even date in March 2026. By year one, you should see an EBITDA of $1,786,000 after accounting for 13% food costs and 7% total franchise-related fees. Still, your net profit depends on maintaining high volume across chicken tender meals and catering streams.
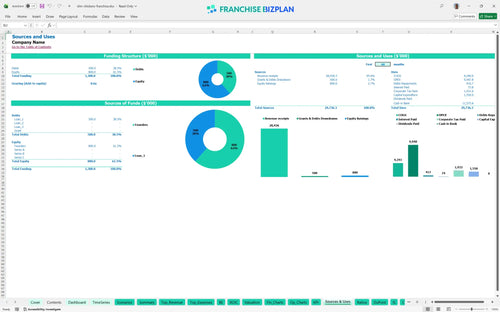
You will need approximately $1.55M to launch this unit in the US, covering the $30,000 franchise fee and $650,000 in leasehold improvements. The capital expenditure budget also includes $420,000 for kitchen equipment and $180,000 for drive-thru infrastructure. Plus, you should keep a $14,000 cash buffer for the first few months of operations.
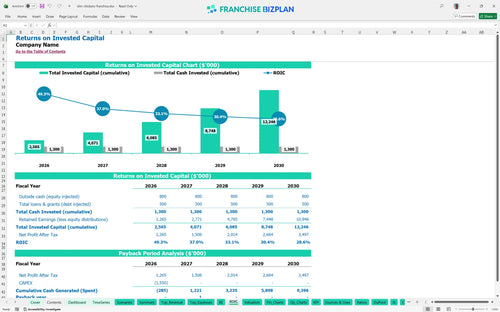
Investors can expect an Internal Rate of Return (IRR) of 9.77% and a Return on Equity (ROE) of 13.68%. The payback period is estimated at 2 years, which is strong for the fast-casual sector. Here's the quick math: with year-one revenue of $3.75M, the high initial CAPEX is recovered relatively fast if you maintain a 13% food cost margin.
The monthly break-even point is reached in month 3, provided you hit the $3.75M annual sales target. The primary driver affecting this is your $20,000 monthly rent and the 5% royalty fee, which create a high fixed-cost floor. If traffic slows, your labor costs for the 12 initial crew members will quickly squeeze your cash flow.
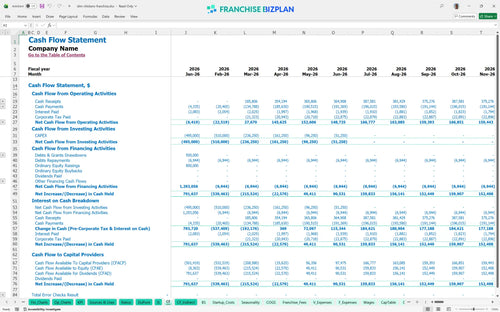
Your lowest cash point hits $14,000 in April 2026, which is quite tight during the ramp-up phase. You need at least 3 months of runway to handle the gap between opening costs and steady revenue. What this estimate hides is the risk of construction delays, so an additional cash buffer is defintely recommended to protect your operations.
The High scenario projects year-5 revenue reaching $8.2M, which significantly shortens your payback period and boosts the 9.77% IRR. In a Low scenario, higher food costs or lower traffic could push the break-even date back several months, increasing your peak cash need. The model shows that even a 2-point shift in COGS changes your year-1 margin by thousands.
This franchise financial model is built in Excel with fully editable assumptions, allowing you to swap out pre-filled data for your specific territory. You can adjust every formula for labor, rent, and local marketing to see how different operating scenarios impact your bottom line without needing to be a spreadsheet pro.

Planning for long-term growth requires a detailed 5-year revenue and cash flow outlook tailored for a fast-casual restaurant business plan. This model tracks your progress from the initial opening through year five, showing how maturing unit economics and repeat demand drive your restaurant P&L statement over time.

Managing ongoing franchise startup costs means tracking the 5% royalty and 2% marketing fund contributions that come off the top. This tool automatically calculates these obligations so you can see the real store-level margin remaining after the franchisor takes their cut. It defintely helps to see the net cash before you commit.

Calculating ROI for a new fast-food franchise location starts with a clear startup cost breakdown for quick service restaurant franchise units. This model aggregates your $1.55M+ initial investment, including leasehold improvements and kitchen equipment, to determine the exact sales volume you need to cover your monthly fixed and variable costs.

We've included built-in industry benchmarks to help you sanity-check your fast food franchise profitability against typical market ranges. If your food costs or labor percentages stray too far from the 13% food ingredient or 2% packaging standards, the model flags it so you can adjust your operational plan accordingly.


Simply purchase and download the financial model template, then access it instantly using Microsoft Excel or Google Sheets. No installation or technical expertise required-just open and start working.

Enter your business-specific numbers, including revenue projections, costs, and investment details. The pre-built formulas will automatically calculate financial insights, saving you time and effort.

Leverage the investor-ready format to confidently showcase your financial projections to banks, franchise representatives, or investors. Impress stakeholders with clear, data-driven insights and professional reports.

Leverage the investor-ready format to confidently present your projections to banks, franchise representatives, or investors.