
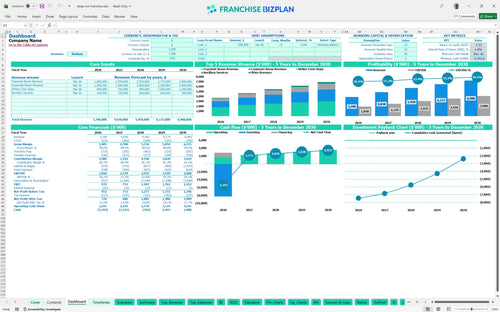
All-in-one Dashboard
Core inputs and core outputs


This hotel franchise financial model excel template provides a complete toolkit for forecasting revenue, managing midscale hotel development costs, and calculating long-term investor returns.
Core inputs and core outputs
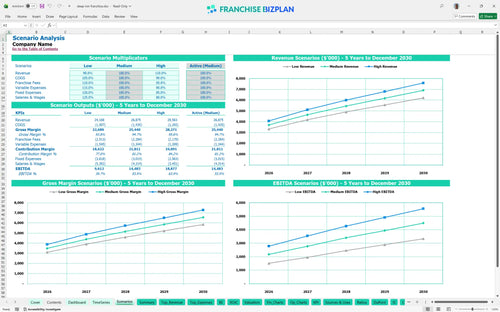
Three scenario analysis
Presentation ready
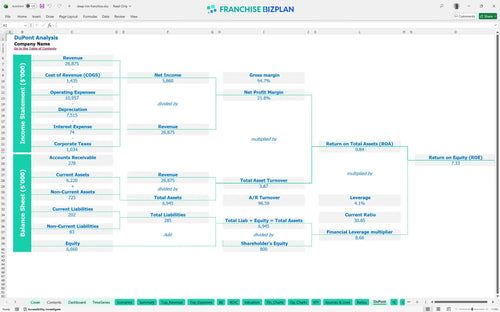
DuPont analysis
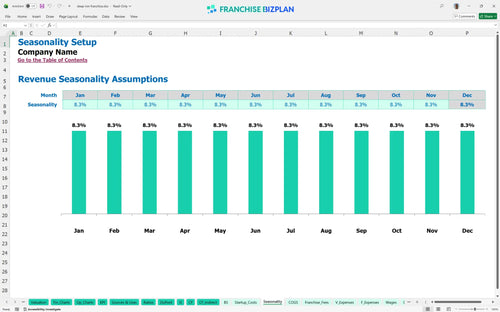
Researched revenue assumptions
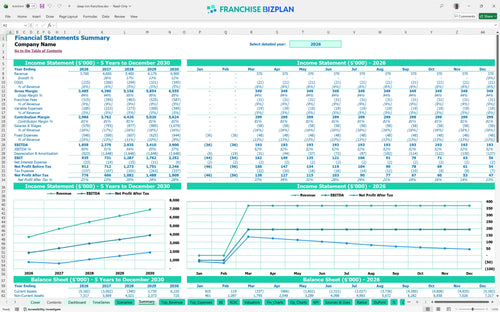
Lender-friendly financial outputs
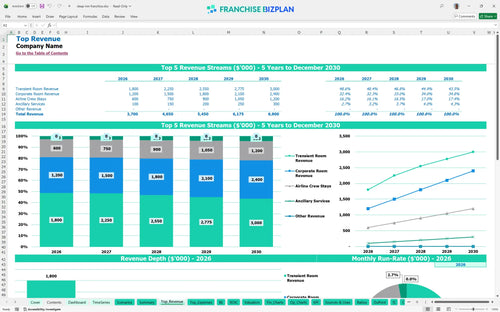
Revenue stream detailed view
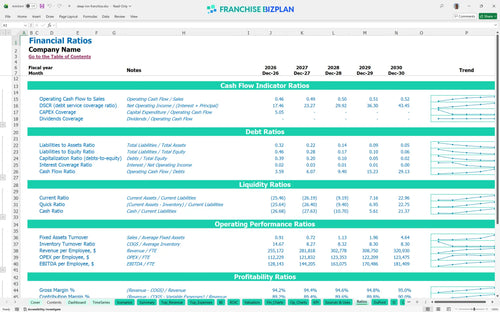
Performance metrics benchmark
We built this franchise unit financial model using detailed research into midscale hotel operations and brand standards. Key assumptions, including $3.7M in year-one revenue and specific staffing needs for 10 housekeepers by year five, are pre-populated with researched data and are fully editable. This tool provides a clear franchise unit profit and loss statement template to help you evaluate the real-world potential of this hospitality concept.
This hotel franchise profitability projection shows the unit reaching a positive EBITDA of $1.85 million in its first year of operation. While the model shows accounting profitability early, true cash flow depends on managing the $35,000 annual front desk agent salaries and the 8.5% total brand fees.
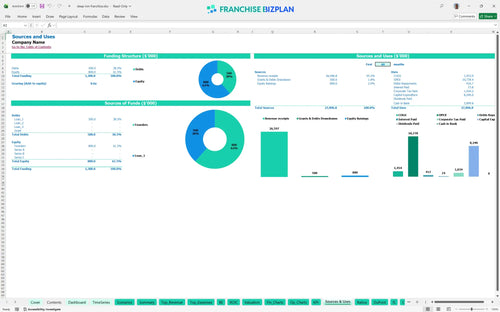
To launch this unit, you will need significant capital to cover the $40,000 franchise fee and $4.5 million in leasehold improvements. The total midscale hotel development costs exceed $8.5 million when including $1.8 million for furnishings and a $300,000 pre-opening budget. Honestly, knowing how to calculate startup costs for a hotel franchise is the only way to avoid mid-project funding gaps.
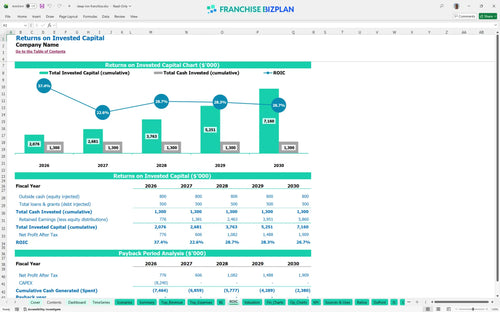
The midscale hotel franchise investment return projection estimates an Internal Rate of Return (IRR) of 1.82% and a Return on Equity (ROE) of 7.33%. Given the heavy upfront CAPEX, the payback period extends beyond the initial five-year window, which is typical for large-scale hospitality assets in this segment.
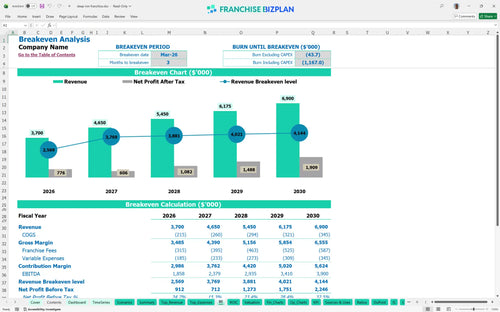
The break-even analysis for hotel franchise ownership indicates a break-even date of March 2026, just three months after launch. This quick operational break-even is driven by the $1.2 million in transient room revenue, but requires maintaining a $28,000 monthly lease payment and managing budgeting for hotel franchise operational expenses.
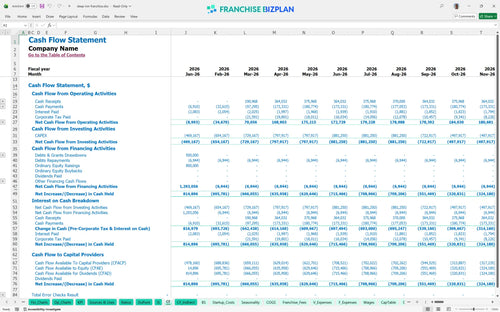
The lowest cash point occurs in December 2026, with a projected deficit of $5.39 million before the ramp-up stabilizes. You defintely need a robust financing plan or equity cushion to handle the timing gaps between construction draws and stabilized occupancy during the first year.
A financial feasibility study for new hotel franchise must compare various market conditions using this franchise business financial forecasting spreadsheet. In a high-revenue scenario, increasing corporate stays can push EBITDA well above the $3.9 million year-five target, while a low-occupancy scenario would deepen the $5.39 million cash trough and delay the small hotel franchise development budget template targets.
This hotel franchise financial model is built in Excel with open formulas, allowing you to tweak every assumption from room rates to occupancy levels. You can adjust the pre-filled data to match your specific territory, whether you are looking at a high-traffic airport location or a suburban corporate hub.

Map out your long-term growth with a franchise business plan template that scales from opening day through year five. The model tracks how revenue grows from $3.7 million in year one to $6.9 million by year five, helping you visualize the impact of compounding occupancy and rate increases.

Managing the hotel franchise royalty and fee structure analysis is critical for maintaining store-level margins. This tool automatically calculates the 5% royalty and 3.5% marketing fee against your projected room revenue, ensuring you always know your net contribution after brand obligations.

Use the franchise startup cost calculator to account for the $4.5 million in leasehold improvements and $1.8 million in furnishings. By analyzing fixed costs like the $28,000 monthly rent alongside variable guest amenities, you can pinpoint the exact revenue needed to stop the bleed.

Our hotel investment analysis spreadsheet includes hospitality industry financial benchmarks to validate your labor and supply costs. For instance, if your linen and laundry supplies exceed the 4% benchmark in year one, the model flags the inefficiency so you can adjust your operational plan.


Simply purchase and download the financial model template, then access it instantly using Microsoft Excel or Google Sheets. No installation or technical expertise required-just open and start working.

Enter your business-specific numbers, including revenue projections, costs, and investment details. The pre-built formulas will automatically calculate financial insights, saving you time and effort.

Leverage the investor-ready format to confidently showcase your financial projections to banks, franchise representatives, or investors. Impress stakeholders with clear, data-driven insights and professional reports.

Leverage the investor-ready format to confidently present your projections to banks, franchise representatives, or investors.