
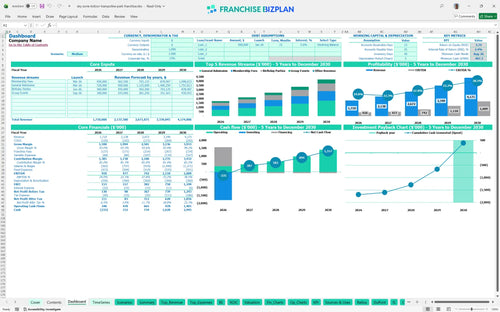
All-in-one Dashboard
Core inputs and core outputs


This model provides a full suite of pro forma statements and specialized calculators to evaluate the feasibility of a new trampoline park location.
Core inputs and core outputs
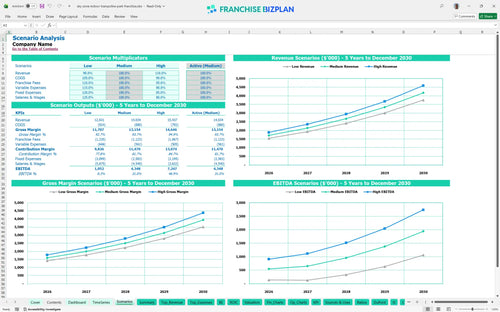
Three scenario analysis
Presentation ready
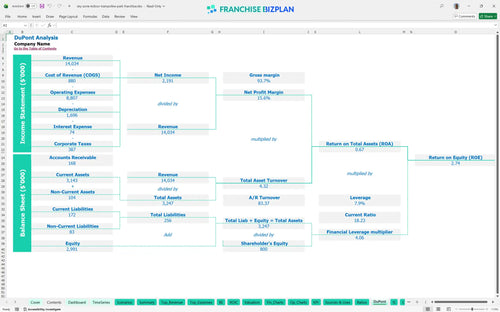
DuPont analysis
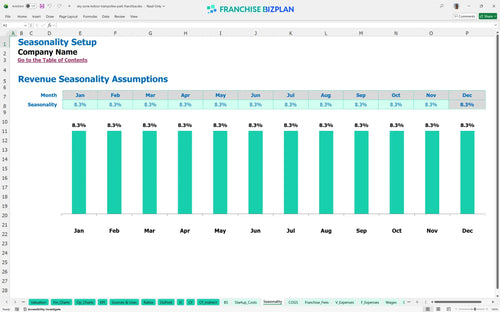
Researched revenue assumptions
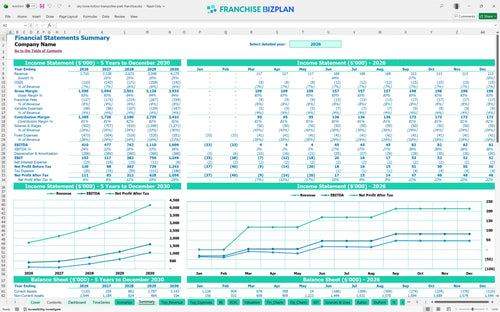
Lender-friendly financial outputs
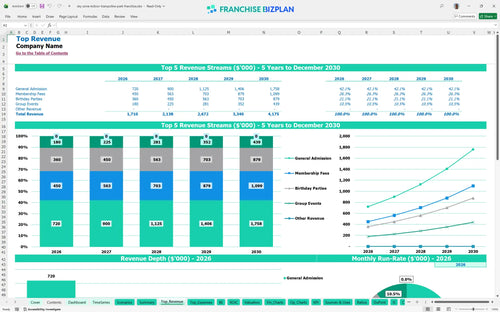
Revenue stream detailed view
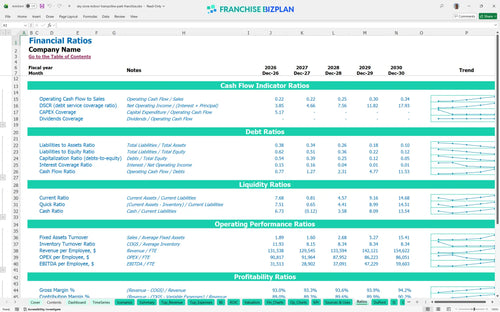
Performance metrics benchmark
We built this franchise unit financial model using intensive research into the indoor recreation sector. Key assumptions like membership fees, party packages, and court monitor staffing are pre-populated for a Sky Zone Indoor Trampoline Park Franchise unit and are fully editable. With Year 1 revenue projected at $1.71 million and EBITDA scaling to over $1.6 million by Year 5, this tool helps you track the path to a 5-year payback.
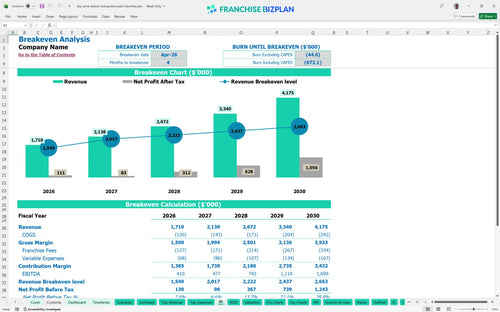
This unit reaches operational profitability quickly, with a break-even date in April 2026, just four months after the start of the year. While Year 1 EBITDA is $410,000, the real gains happen in Year 5 as revenue hits $4.17 million after accounting for all royalties and fixed costs.
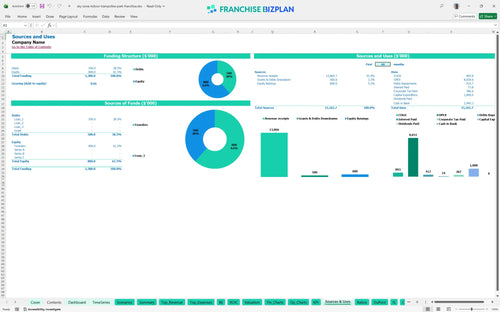
You need approximately $1.8 million in total capital to cover the heavy equipment and build-out costs for this franchise unit in the US. The model shows a minimum cash requirement of -$407,000 in August 2026, suggesting you need a strong working capital reserve during the first six months of operations.
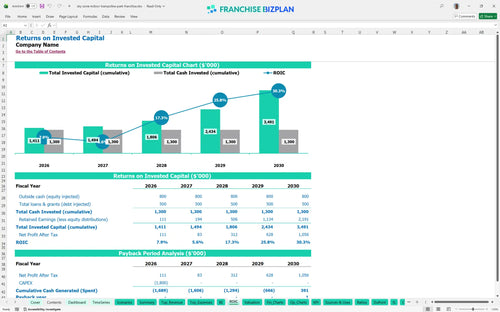
The model projects a 5-year payback period with an Internal Rate of Return (IRR) of 2.45% and a Return on Equity (ROE) of 2.74%. While the initial ROI is modest, the enterprise value grows significantly as EBITDA more than triples between Year 2 and Year 5.
The unit hits its monthly break-even point four months into the 2026 fiscal year. Reaching this point depends heavily on hitting the $480,000 Year 1 target for general admission sales while managing the $25,000 monthly facility rent and 6% royalty burden.
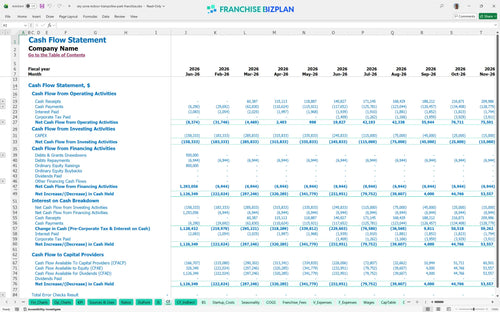
Your lowest cash point occurs in August 2026 at -$407,000, which reflects the lag between heavy CAPEX and the ramp-up of group event revenue. You should secure a credit line or cash buffer to cover at least six months of fixed expenses during the launch phase.
Moving from a Medium to a High scenario involves maximizing throughput during peak weekend hours. The model shows that even small increases in 'After Dark' event attendance can significantly pull forward the payback period and improve the Year 1 margin for the franchise unit.
Finance: update unit break-even and payback model by Friday.
This franchise financial model template is a flexible Excel tool designed for precision. You can swap pre-filled numbers for your specific site data, adjusting everything from local rent to hourly wages. It uses dynamic formulas so that a change in your average ticket price instantly updates your five-year outlook.

Planning for a high-volume entertainment center requires a multi-year view of cash flow and debt service. This model provides 60 months of detail to help you visualize the ramp-up from opening day to full capacity. It maps out how increasing membership revenue stabilizes the bottom line as the business matures.

Royalties and marketing fees are non-negotiable costs that impact your store-level margin every month. This entertainment center financial projection accounts for the 6% royalty and 2% brand fund contributions automatically. By modeling these fees against gross sales, you see exactly how much cash stays in your pocket after the franchisor gets paid.

Launching a large-scale park involves heavy upfront capital for equipment and leasehold improvements. This franchise startup cost calculator aggregates your $1.8 million in initial outlays to find your exact survival point. Knowing your monthly break-even helps you manage the critical first year when traffic is still building.

Comparing your projections to industry norms prevents optimism bias during the planning phase. The model includes typical labor and occupancy ranges for indoor recreation to ensure your budget is realistic. If your projected margins are way outside the norm, you can defintely spot the error before signing a lease.


Simply purchase and download the financial model template, then access it instantly using Microsoft Excel or Google Sheets. No installation or technical expertise required-just open and start working.

Enter your business-specific numbers, including revenue projections, costs, and investment details. The pre-built formulas will automatically calculate financial insights, saving you time and effort.

Leverage the investor-ready format to confidently showcase your financial projections to banks, franchise representatives, or investors. Impress stakeholders with clear, data-driven insights and professional reports.

Leverage the investor-ready format to confidently present your projections to banks, franchise representatives, or investors.