
All-in-one Dashboard
Core inputs and core outputs


This franchise unit financial performance model provides a complete Excel-based toolkit for projecting 5-year P&L, cash flow, and ROI for a casual dining location.
Core inputs and core outputs
Three scenario analysis
Presentation ready
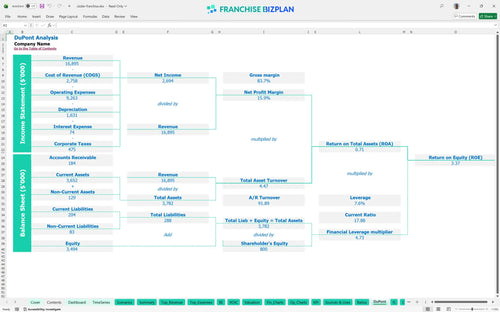
DuPont analysis
Researched revenue assumptions
Lender-friendly financial outputs
Revenue stream detailed view
Performance metrics benchmark
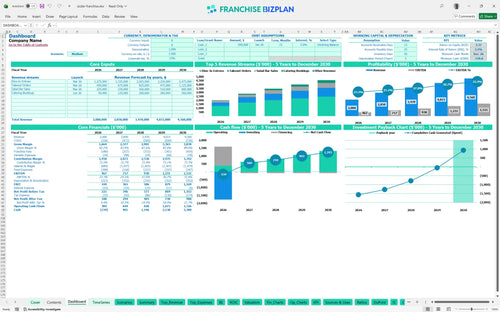
We built this restaurant franchise unit economics spreadsheet using our own research on casual dining performance. Key assumptions like the $850,000 build-out and 4% royalty fees are pre-populated and fully editable. Here is the quick math: with a $2.0M year-one revenue target and a 4-month break-even, the model shows a path to a $1.52M EBITDA by year five.
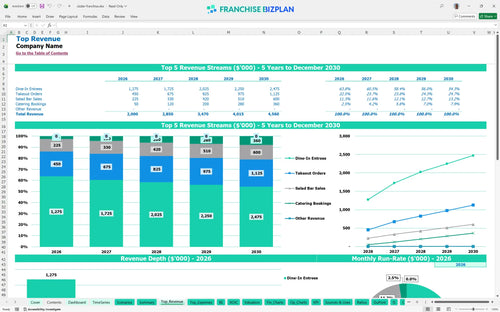
The unit hits profitability in its first year, with a projected EBITDA of $467,000 on $2,000,000 in sales. By year three, as catering and takeout scale, net profit margins expand significantly alongside a $3,470,000 revenue target.
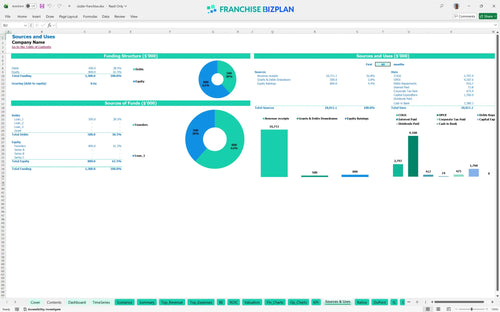
You will need approximately $1,760,000 to launch this unit in the US, covering the $35,000 franchise fee and $850,000 in leasehold improvements. This franchise investment projection template also includes $120,000 for a dedicated express pickup setup to capture off-premise demand.
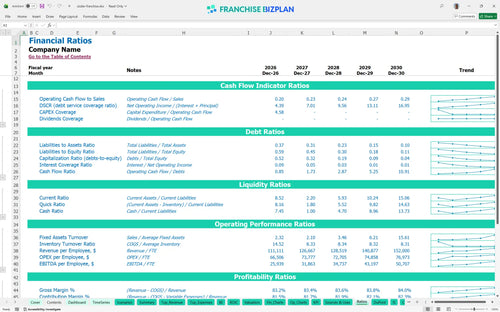
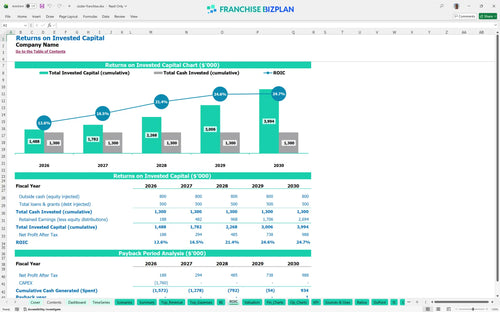
The ROI analysis shows a 5-year payback period with an Internal Rate of Return (IRR) of 3.21%. While the initial cash outlay is heavy, the scaling EBITDA reaching $1,521,000 by year five creates a solid long-term equity play for a multi-unit operator.
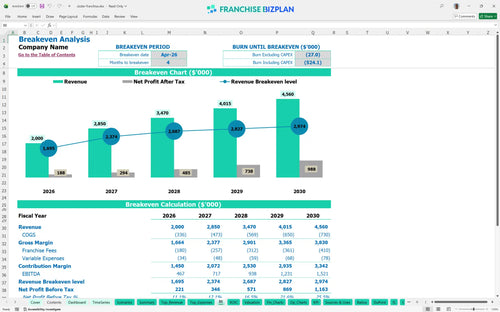
Estimating break-even point for a new restaurant location shows this unit needs to trade for 4 months to cover its monthly burn. With $18,000 in rent and high fixed labor, hitting the $2.0M year-one revenue target is critical to stop the initial cash bleed.
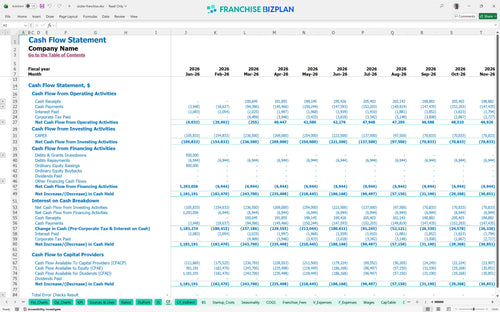
The lowest cash point hits -$159,000 in December 2026, meaning you need a solid working capital cushion beyond the initial construction costs. Financial feasibility study for a new restaurant franchise suggests keeping extra liquidity to handle the gap between opening and full ramp-up.
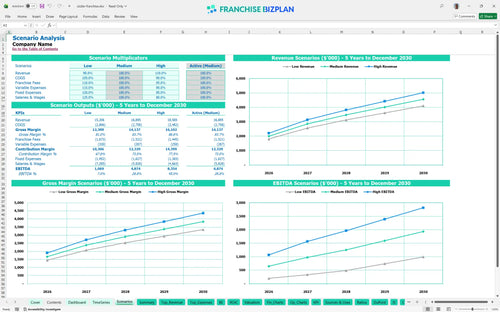
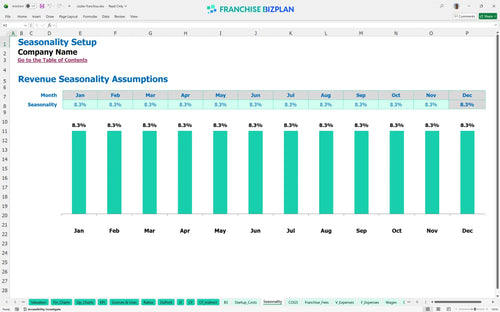
How to forecast monthly sales for a casual dining franchise involves looking at Low vs High cases. A 10% drop in dine-in revenue could push your payback out by two years, while hitting the High case through strong catering bookings ($360,000 by year 5) significantly boosts your ROE.
This franchise financial model template is built in Excel, allowing you to swap out every assumption from steak prices to server wages. It uses pre-filled formulas so you can test how a 10% jump in food costs or a dip in dining room traffic affects your bottom line instantly. Honestly, a static plan is useless in the restaurant world, so we made this one fully editable to match your specific territory. Plus, the Excel template for restaurant franchise financial projections ensures you don't have to be a math whiz to see the impact of a new lease or higher utility bills.

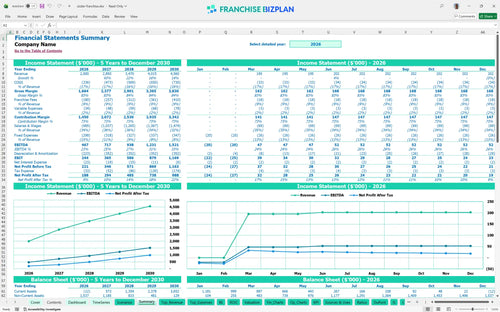
You need to see past the grand opening to understand if the unit is sustainable over the long haul. This restaurant franchise business plan tool maps out five years of performance, showing revenue climbing from $2,000,000 in year one to $4,560,000 by year five. It tracks EBITDA (earnings before interest, taxes, depreciation, and amortization) so you can see when the cash flow actually starts to stack up. Still, remember that these projections depend on hitting your ramp-up targets in the first 12 months.

Analyzing royalty and marketing fees in franchise models is the only way to see your true store-level margin. This model accounts for the $35,000 upfront fee plus the ongoing 4% royalty and 5% marketing fund contributions. At $2,000,000 in sales, that is $180,000 leaving the building before you pay for a single steak or light bulb. It is a big number, but it covers the brand standards and national reach that bring people through the door.

How to calculate startup costs for a restaurant franchise starts with the big-ticket items like the $850,000 leasehold improvements and $420,000 in kitchen equipment. This franchise startup cost calculator shows you exactly when you hit the break-even point-estimated here at April 2026. Knowing your fixed costs, like the $18,000 monthly rent, helps you set the daily sales targets needed to stay in the black. Every dollar spent on the $120,000 express pickup setup needs to be justified by faster throughput.

We defintely included benchmarks to keep your projections grounded in reality. If your food costs are sitting at 15% but the industry average is higher, the model flags it so you can investigate. This restaurant profitability analysis tool compares your labor spend and occupancy costs against standard franchise performance to ensure your plan isn't just wishful thinking. It is about sanity-checking the $90,000 GM salary and the $28,000 host wages against the $2.0M revenue floor.


Simply purchase and download the financial model template, then access it instantly using Microsoft Excel or Google Sheets. No installation or technical expertise required-just open and start working.

Enter your business-specific numbers, including revenue projections, costs, and investment details. The pre-built formulas will automatically calculate financial insights, saving you time and effort.

Leverage the investor-ready format to confidently showcase your financial projections to banks, franchise representatives, or investors. Impress stakeholders with clear, data-driven insights and professional reports.

Leverage the investor-ready format to confidently present your projections to banks, franchise representatives, or investors.