
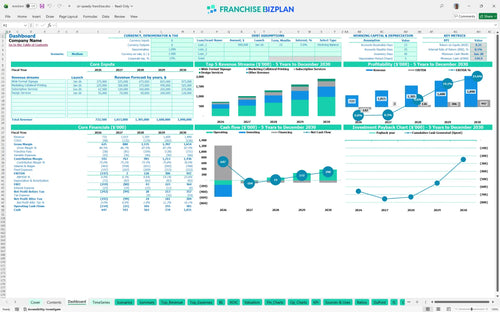
All-in-one Dashboard
Core inputs and core outputs


The franchise unit financial model template includes a full 5-year P&L, startup cost breakdown, and dynamic revenue drivers for signage and design services.
Core inputs and core outputs
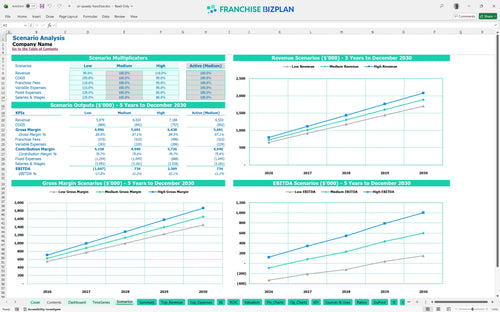
Three scenario analysis
Presentation ready
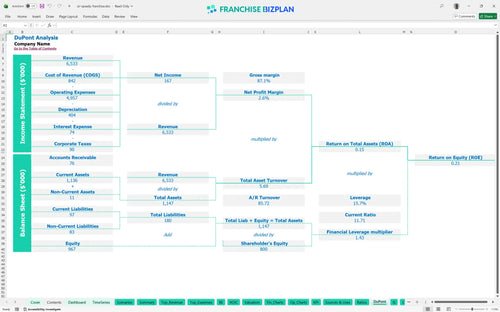
DuPont analysis
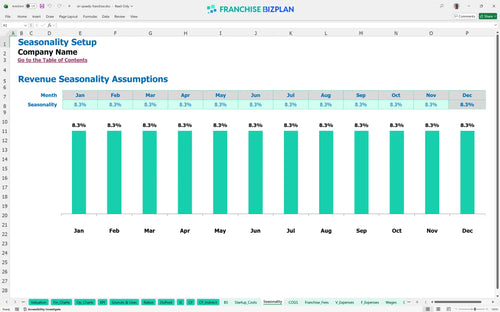
Researched revenue assumptions
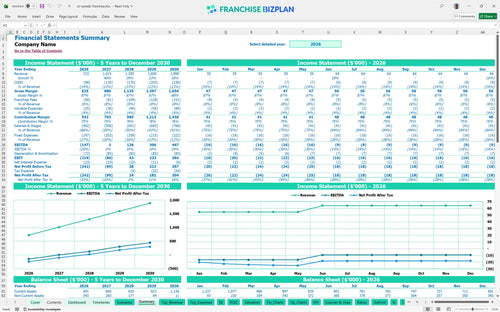
Lender-friendly financial outputs
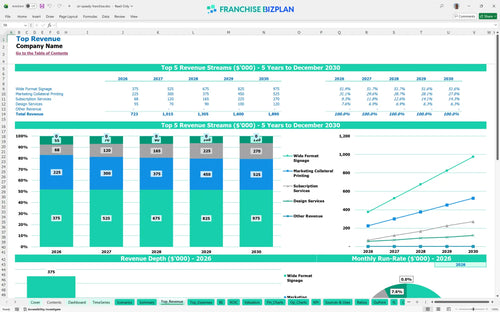
Revenue stream detailed view
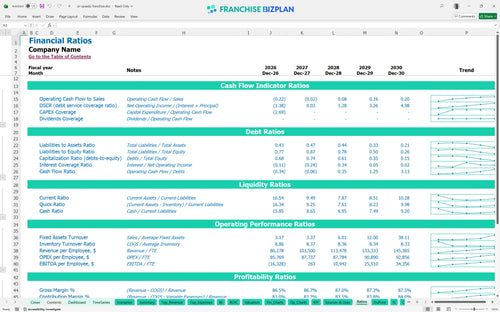
Performance metrics benchmark
We built this franchise unit financial model using our own research into the commercial printing sector and B2B marketing service model. Key assumptions like the $55,000 franchise fee and the 52% internal rate of return are pre-populated with researched data and are fully editable to fit your specific location.
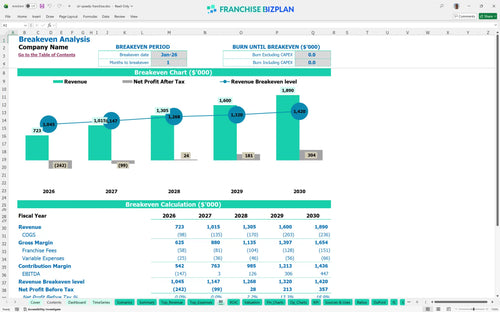
This unit is projected to reach a positive EBITDA of $3,000 in year two, following an initial year-one loss of $147,000. By year five, net profit scales significantly as revenue from wide format signage and subscription services reaches its full potential.
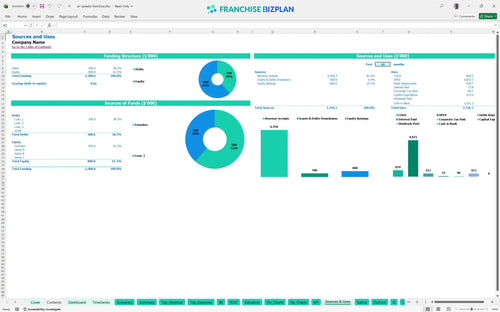
To launch this unit in the US, you need to cover $415,000 in initial CAPEX plus working capital. The total investment includes $55,000 for the franchise fee, $120,000 for leasehold improvements, and $90,000 for wide format printers.
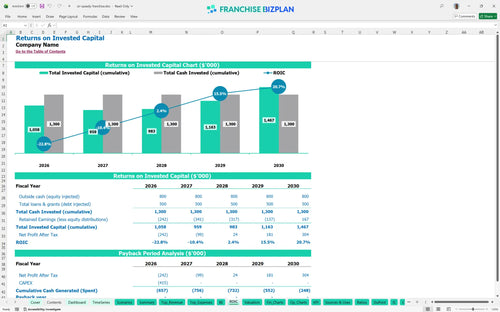
Investors can expect a 52% internal rate of return (IRR) and a 21% return on equity (ROE) over the five-year period. While the model shows a payback period extending past year five, the cash flow growth from $126,000 in year three to $447,000 in year five demonstrates strong value creation.
The model indicates an operational break-even date in January 2026, assuming you hit your initial revenue targets for marketing collateral. The primary driver for reaching this point is managing the $10,000 monthly rent and the high fixed labor costs of your specialized design and production team.
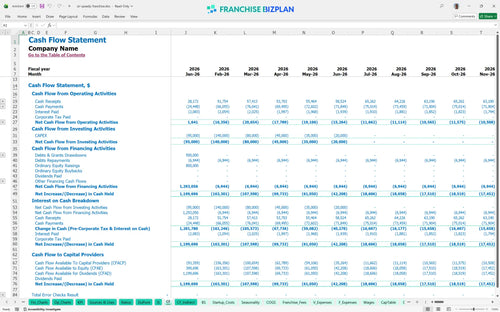
The lowest cash point is projected at $540,000 in January 2028, suggesting you need a substantial buffer to handle the ramp-up phase. You should defintely maintain a liquidity reserve to cover the gap between year-one losses and year-two stabilization.
Moving from a medium to a high scenario significantly accelerates the 52% IRR by increasing throughput in high-margin wide format signage. Low scenarios, where revenue lags behind the $723,000 year-one target, will deepen the initial $147,000 loss and delay the year-two turn to profitability.
Finance: update unit break-even and payback model by Friday.
This franchise unit financial model is an adaptable Excel tool that allows you to swap out core assumptions for your specific territory. You can adjust everything from local rent to production volume, ensuring the projections match your actual market conditions rather than just a generic corporate average.

The model maps out a path from $723,000 in year one to $1,890,000 by year five, giving you a clear view of long-term scaling. It tracks the shift from initial losses to a projected $447,000 EBITDA as your B2B contracts and subscription services mature over time.

Operating under a brand means accounting for a 6% royalty and a 2% marketing fee on every dollar of revenue. This model automates these calculations, so you see exactly how much goes to the franchisor before you cover your $10,000 monthly rent or payroll for your production techs.

Launching this commercial printing franchise investment requires a significant upfront layout, including a $55,000 franchise fee and $120,000 for leasehold improvements. The model calculates your break-even point, showing that while you might hit operational break-even quickly, recovering the total investment takes focused execution.

We include benchmarks for printing materials at roughly 10% of sales and labor costs for a full team, from designers to production technicians. These guardrails help you verify if your $10,000 monthly rent or $1,000 local advertising budget is in line with successful multi-unit operator standards.


Simply purchase and download the financial model template, then access it instantly using Microsoft Excel or Google Sheets. No installation or technical expertise required-just open and start working.

Enter your business-specific numbers, including revenue projections, costs, and investment details. The pre-built formulas will automatically calculate financial insights, saving you time and effort.

Leverage the investor-ready format to confidently showcase your financial projections to banks, franchise representatives, or investors. Impress stakeholders with clear, data-driven insights and professional reports.

Leverage the investor-ready format to confidently present your projections to banks, franchise representatives, or investors.