
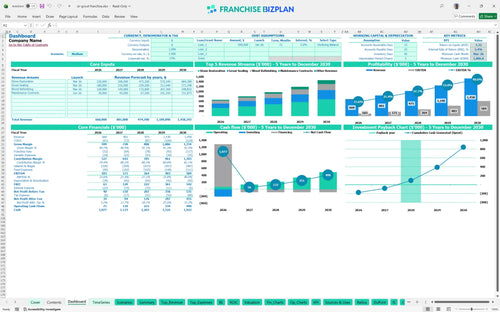
All-in-one Dashboard
Core inputs and core outputs


This franchise unit financial model template provides a comprehensive franchise startup cost calculator, 5-year revenue projections, and a detailed break-even analysis for a home restoration business.
Core inputs and core outputs
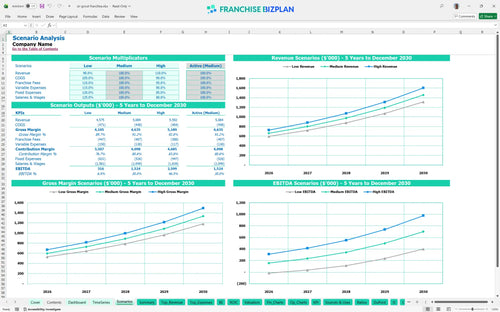
Three scenario analysis
Presentation ready
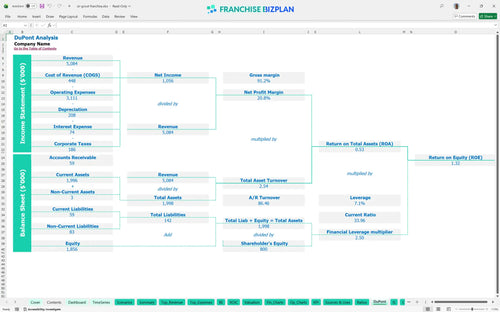
DuPont analysis
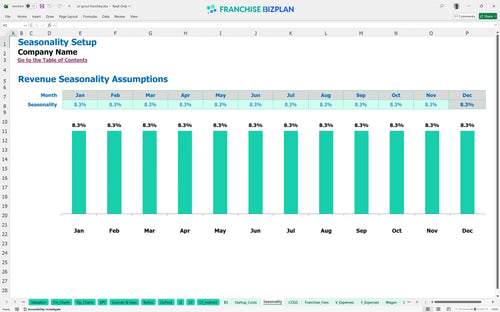
Researched revenue assumptions
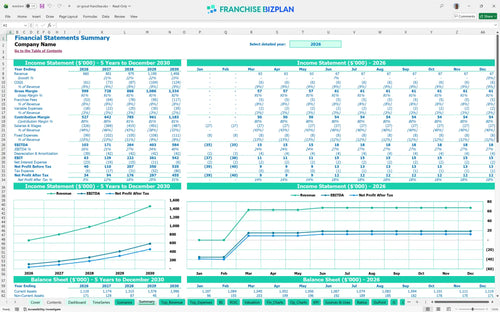
Lender-friendly financial outputs
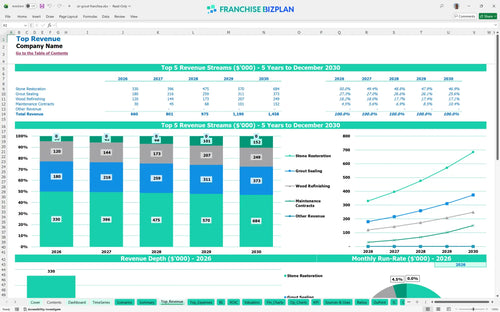
Revenue stream detailed view
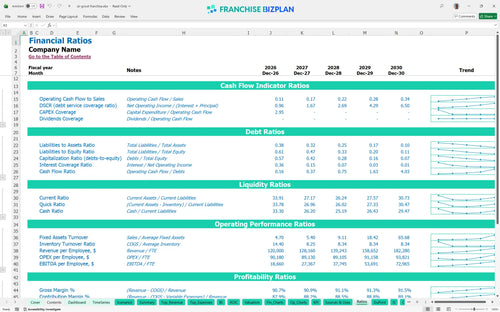
Performance metrics benchmark
We built this franchise unit financial model using our own research into the hard surface restoration industry. Key assumptions for revenue streams like Stone Restoration and Grout Sealing, along with the 6% royalty and 2% marketing fee, are pre-populated with researched data and are fully editable. With Year 1 revenue starting at $660,000 and EBITDA at $103,000, the model provides a data-driven look at the store-level margin.
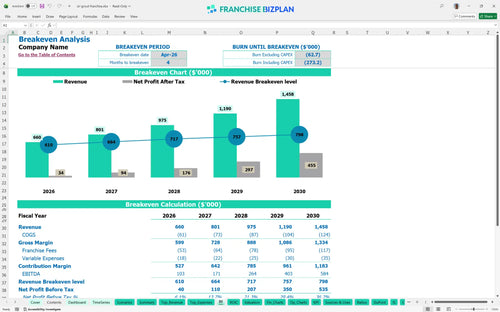
The unit becomes profitable within its first year, generating $103,000 in EBITDA on $660,000 in sales. Since the break-even date is April 2026, you only face four months of operating losses before the cash flow turns positive.
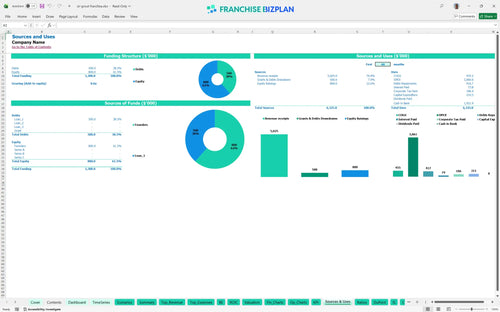
Launching this unit requires a total initial investment of $210,500 for equipment and fees, plus a substantial cash reserve. The model indicates a minimum cash requirement of $1,006,000 to navigate the early ramp-up phase safely and handle the $70,000 vehicle investment.
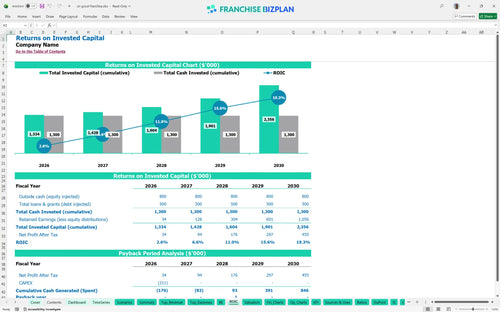
You can expect an Internal Rate of Return (IRR) of 5.43% and a Return on Equity (ROE) of 1.32. The payback period is 3 years, which is standard for a service business with significant vehicle and equipment needs.
The monthly break-even point is reached in April 2026, just 4 months after starting. The biggest driver for this is labor efficiency, as you'll be carrying a $75,000 Operations Manager and a $62,000 Lead Technician from day one.
The lowest cash point occurs in March 2026, with a balance of $1,006,000. You defintely want to ensure your Sales Specialist hits the ground running to avoid extending the 4-month break-even window and burning through your buffer.
The model compares scenarios where Year 1 revenue starts at $660,000 and grows to $1.45M by Year 5. In the high-growth case, adding extra technicians allows you to capture more of the $456,192 Stone Restoration potential, jumping EBITDA to $584,000.
Finance: update unit break-even and payback model by Friday.
This franchise unit financial model is built in Excel with fully editable assumptions and pre-filled formulas, allowing you to adapt the numbers to your specific territory or market conditions. You can adjust everything from local labor rates to specific service pricing, making it easy to see how different operating scenarios impact your bottom line. Every 1-point margin leak matters fast in a single-unit model.

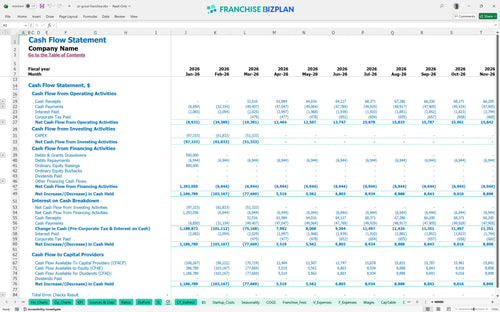
Plan for long-term growth with a detailed 5-year forecast covering revenue, expenses, and cash flow for your restoration unit. The model tracks the ramp-up from initial launch to a mature state, helping you visualize how scaling your technician team impacts total profitability over time. Timing gaps between opening costs and mature-unit performance can bite if you aren't looking.

This tool specifically tracks franchise-related obligations, including the 6% royalty and 2% marketing fund contributions, to give you a clear picture of your net margin after franchisor fees. By modeling these costs against your gross sales, you can ensure your local overhead stays within a sustainable range. Royalties are a top-line tax, so your gross margin must be bulletproof.

Estimate your total initial investment and identify exactly when your unit will stop burning cash and start generating profit. The model breaks down fixed costs like the $3,000 monthly vehicle lease and $900 rent against variable costs to find your monthly break-even sales target. Break-even depends less on headline sales and more on manager productivity.

The model includes industry-standard benchmarks for labor, consumables, and marketing to help you sanity-check your projections against typical performance in the home restoration sector. Comparing your expected margins to these benchmarks helps identify potential red flags in your site selection or staffing plan. Benchmarks keep your ego from writing checks the cash flow can't cash.


Simply purchase and download the financial model template, then access it instantly using Microsoft Excel or Google Sheets. No installation or technical expertise required-just open and start working.

Enter your business-specific numbers, including revenue projections, costs, and investment details. The pre-built formulas will automatically calculate financial insights, saving you time and effort.

Leverage the investor-ready format to confidently showcase your financial projections to banks, franchise representatives, or investors. Impress stakeholders with clear, data-driven insights and professional reports.

Leverage the investor-ready format to confidently present your projections to banks, franchise representatives, or investors.