
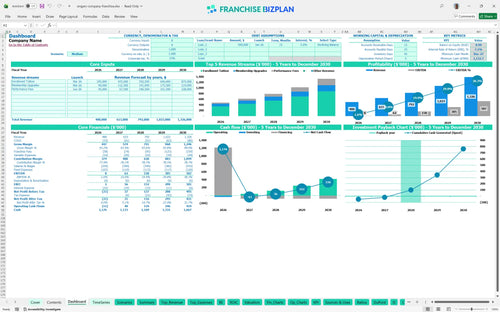
All-in-one Dashboard
Core inputs and core outputs


This performing arts franchise financial projection contains detailed revenue modeling, capital expenditure budgets, and multi-year cash flow statements designed for unit-level analysis.
Core inputs and core outputs
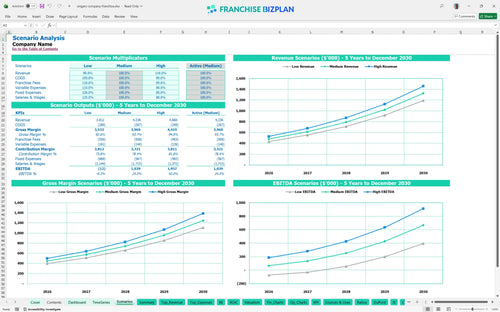
Three scenario analysis
Presentation ready
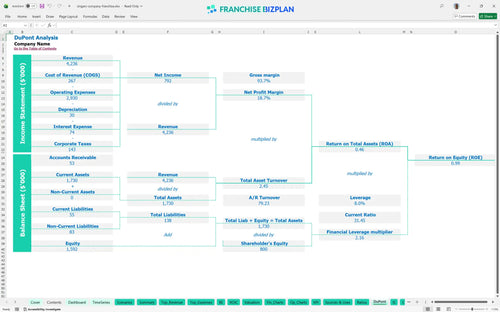
DuPont analysis
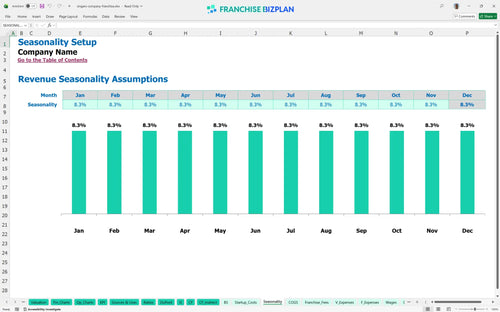
Researched revenue assumptions
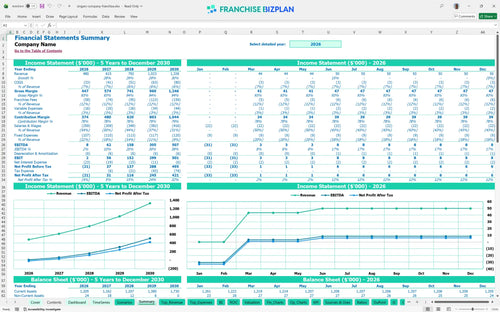
Lender-friendly financial outputs
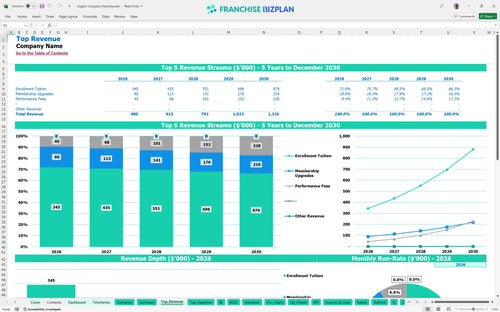
Revenue stream detailed view
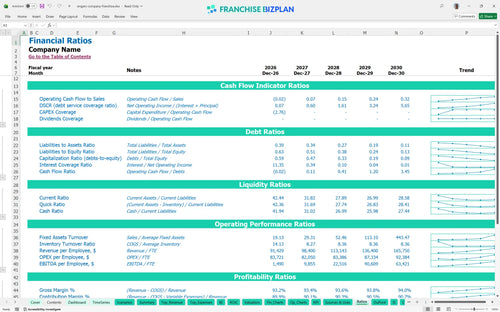
Performance metrics benchmark
We built this franchise unit financial model using our own research into the boutique youth activity sector. Key assumptions, including the $230,000 year-one enrollment tuition and the 10% royalty fee, are pre-populated and fully editable to reflect your specific market. This tool provides a credible roadmap for how to create a financial model for a performing arts franchise without starting from scratch.
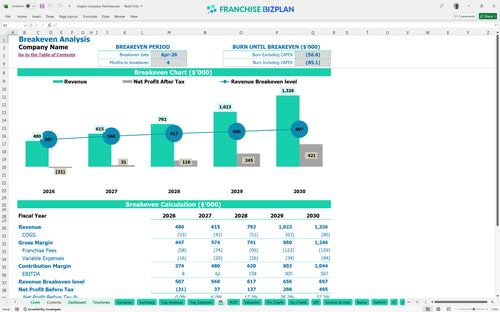
The unit reaches profitability in year one with an initial EBITDA of $8,000, which scales aggressively to $507,000 by year five. You will defintely see the impact of scaling revenue from $480,000 to $1,326,000 as you fill your classes. Estimating profitability for a new franchise location is simpler when you see the margin expansion from year to year.
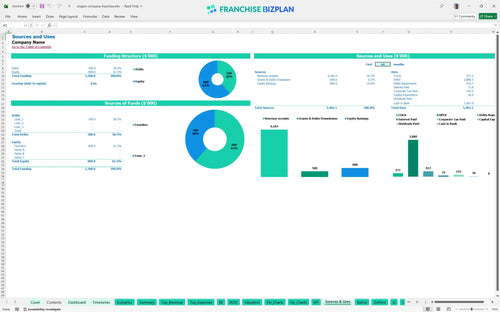
You need a total initial investment that covers the $23,600 franchise fee and $2,500 in leasehold improvements. This Excel template for franchise unit startup costs summarizes your capital expenditure budget, including $1,200 for sound equipment and $800 for mirrors and flooring. Most of your capital goes toward the brand entry fee and setting up a high-quality studio environment.
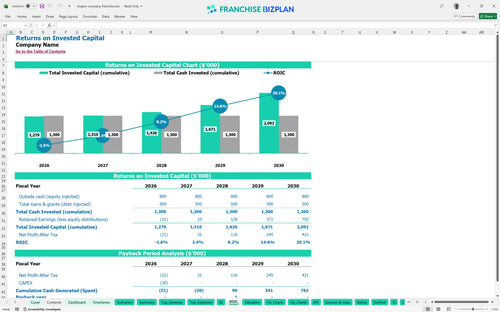
Franchisees can expect a 3-year payback period and an internal rate of return (IRR) of 7.08%. Calculating return on investment for youth enrichment franchises shows a return on equity (ROE) of 0.99, reflecting the steady cash flow once the unit is ramped. These metrics provide a clear picture of the long-term value of the territory.
The unit hits its monthly break-even point in April 2026, just four months after opening. This franchise unit cash flow projection spreadsheet shows that the $6,500 monthly rent is the biggest fixed hurdle you must clear. Reaching this point quickly depends on hitting your year-one enrollment target of $230,000 in tuition revenue.
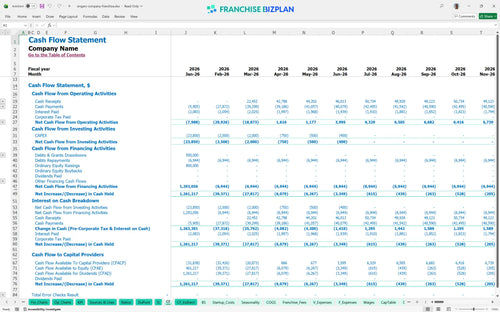
The lowest cash point occurs in December 2027 at $1,133,000, suggesting a significant capital cushion is maintained throughout the ramp-up. Using an operational expense model for performing arts centers helps you monitor the $65,000 director salary and other fixed costs. You should still keep a buffer for seasonal dips in performance fees.
Financial forecasting for retail-based franchise units shows that high-performance scenarios can drive year-five EBITDA to $507,000. Low-performance cases might delay the 3-year payback, but the 10% royalty and 2% marketing fees remain constant. Understanding these swings helps you prepare for different enrollment levels in your local market.
Finance: update unit break-even and payback model by Friday.
This franchise financial model template is built in Excel with a flexible architecture that lets you swap out any assumption. You can adjust local rent, state-specific labor rates, and enrollment targets to see how they impact your bottom line in real-time. The pre-filled formulas handle the heavy lifting, so you focus on the strategy of your performing arts franchise financial projection.

Success in the youth enrichment space requires a long-term view of how your unit scales from launch to maturity. This franchise business plan spreadsheet maps out a 5-year path, showing revenue growing from $480,000 in year one to over $1.3 million by year five. It provides a clear look at how store-level EBITDA improves as you optimize your instructional staff and maximize studio throughput.

Managing the financial obligations to the franchisor is critical for maintaining your store-level margin. This tool includes precise royalty fee forecasting at 10% and marketing fund contributions at 2%, ensuring you know exactly how much cash leaves the business before you pay your local bills. It simplifies the ongoing franchise cost tracking so there are no surprises during your monthly reconciliation.

Our franchise startup cost calculator breaks down the initial investment, from the $23,600 franchise fee to the $1,200 sound equipment package. By identifying your fixed costs, like the $6,500 monthly rent, and your variable costs, the model determines your break-even point. This helps you understand the exact enrollment volume needed to stop burning cash and start generating a return.

This franchise profitability analysis tool uses researched benchmarks to help you sanity-check your operating expense breakdown. We have included typical ranges for instructional materials and costume costs to ensure your projections are grounded in reality. Comparing your expected performance against these standards helps you identify potential margin leaks before you even sign a lease.


Simply purchase and download the financial model template, then access it instantly using Microsoft Excel or Google Sheets. No installation or technical expertise required-just open and start working.

Enter your business-specific numbers, including revenue projections, costs, and investment details. The pre-built formulas will automatically calculate financial insights, saving you time and effort.

Leverage the investor-ready format to confidently showcase your financial projections to banks, franchise representatives, or investors. Impress stakeholders with clear, data-driven insights and professional reports.

Leverage the investor-ready format to confidently present your projections to banks, franchise representatives, or investors.