
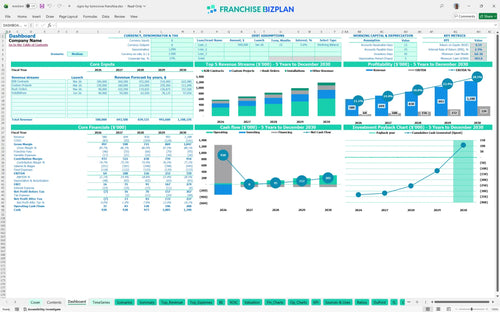
All-in-one Dashboard
Core inputs and core outputs


This franchise financial model template includes a comprehensive Excel-based toolkit featuring 5-year projections, automated royalty tracking, and detailed startup cost schedules for a signage business.
Core inputs and core outputs
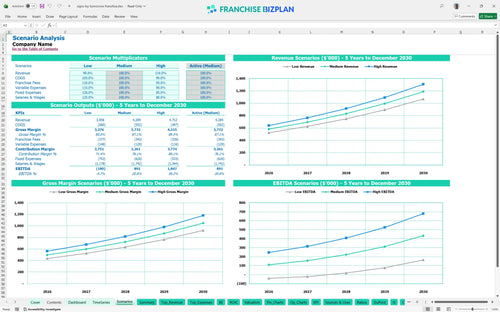
Three scenario analysis
Presentation ready
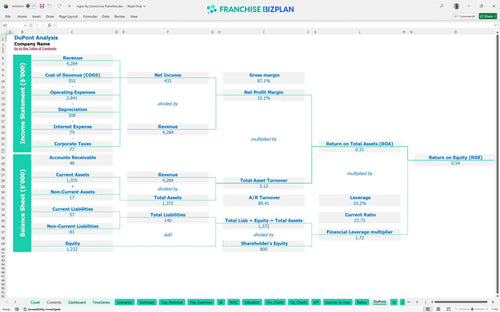
DuPont analysis
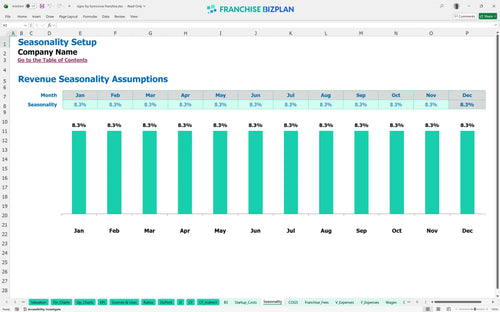
Researched revenue assumptions
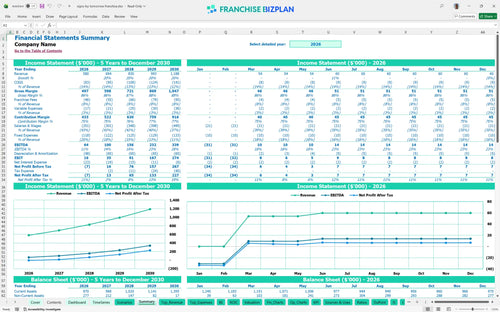
Lender-friendly financial outputs
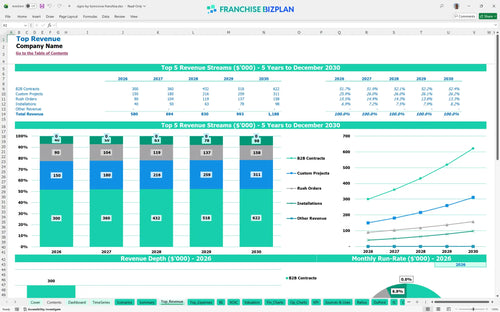
Revenue stream detailed view
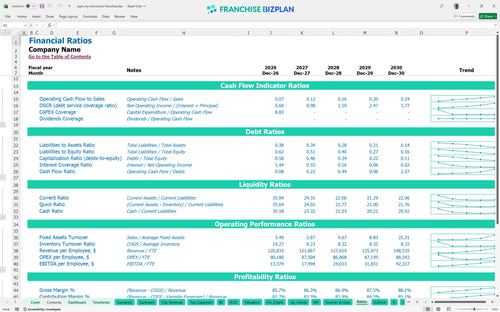
Performance metrics benchmark
We built this signage franchise unit financial model using our own research to ensure every B2B revenue stream and operational cost is grounded in reality. Key assumptions like the $40,000 franchise fee, 6% royalty, and $65,000 digital printing equipment are pre-populated and fully editable to fit your specific territory. With a projected Year 1 EBITDA of $64,000 and a 4-month window to breakeven, this tool helps you map a clear path to the $1.18M revenue target by Year 5.
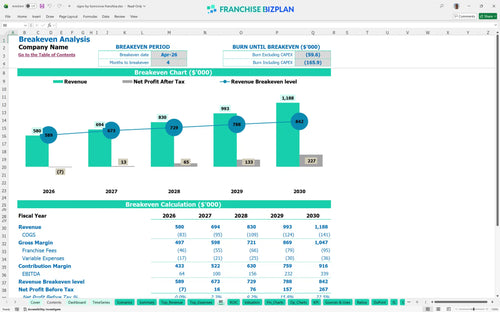
This signage unit becomes profitable very quickly, hitting its breakeven point by April 2026, just four months after launch. By Year 3, the model projects an EBITDA of $156,000 after accounting for all COGS, the 8% total franchise fees, and fixed costs like the $5,800 monthly rent. Speed to profit is the ultimate franchise metric.
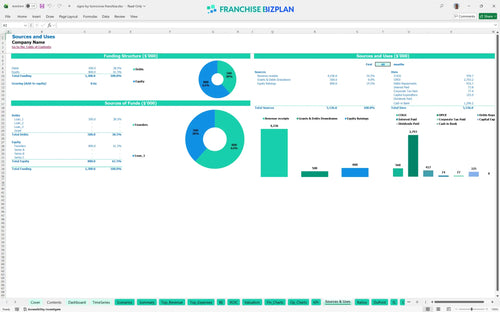
You need a total initial investment of approximately $325,000 to cover the franchise fee, equipment, and build-out, though the model suggests a minimum cash requirement of $903,000 to handle ramp-up and working capital. This covers everything from the $100,000 in leasehold improvements to the $65,000 digital printing setup and initial $40,000 fee. Don't start a race without enough fuel in the tank.
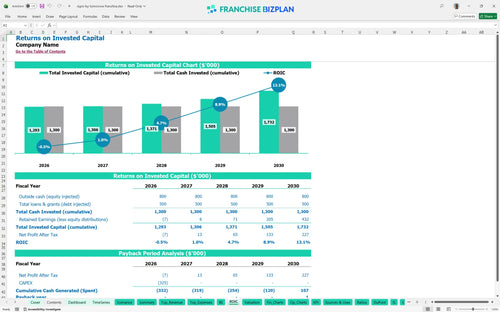
The model projects a 5-year payback period with an Internal Rate of Return (IRR) of 2.34% and a Return on Equity (ROE) of 0.54. While the initial years focus on recovering the $325,000 CAPEX, the Year 5 EBITDA of $339,000 shows the long-term cash flow potential of a mature B2B service location. Patience pays off when the EBITDA starts to compound.
The unit reaches break-even in April 2026, requiring enough monthly revenue to cover roughly $9,850 in fixed operating costs plus variable labor and royalties. The primary driver for hitting this goal is securing B2B contracts early, as they represent the largest revenue stream at $200,000 in the first year. Volume solves most problems, but margins solve the rest.
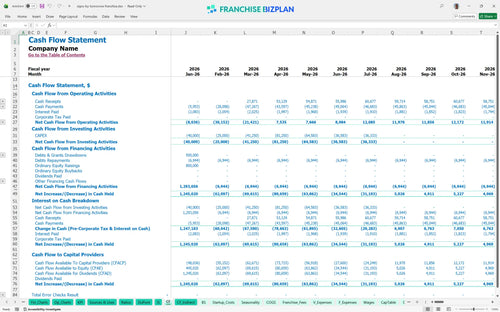
The lowest cash point occurs in July 2026, roughly four months after the revenue launch, as the business finishes paying for equipment like the installation vehicle and showroom fixtures. You need to maintain a solid buffer to handle the $15,000+ monthly payroll for the manager, designer, and production crew during the initial ramp. Cash is oxygen; don't hold your breath during the ramp-up.
A high-performance scenario where B2B contracts grow 20% faster can significantly accelerate the 5-year payback and improve the 2.34% IRR. Conversely, if Year 1 revenue misses the $580,000 target, the peak cash need in July 2026 will increase, making tight control over the $5,800 rent and $1,400 utilities even more critical. Planning for the worst makes the best even better.
Finance: update unit break-even and payback model by Friday.
This franchise unit financial model template lives in Excel, giving you total control over every assumption from B2B contract volume to rush order premiums. You can adjust the pre-filled formulas to match your specific territory, ensuring the franchise unit financial projections reflect your local market reality rather than just a corporate average. Your model should be as flexible as your shop's production schedule.

Mapping out a five-year horizon is critical for a business plan for printing franchise to understand how a unit scales from $580,000 in Year 1 to over $1.1M by Year 5. This model provides a detailed look at how EBITDA grows as you add production and installation capacity to handle more complex environmental graphic projects. Growth is a marathon, not a sprint, especially in B2B services.

The model bakes in the 6% royalty and 2% marketing fund contributions automatically, so you see the exact impact of franchise royalty fees on your store-level margin. By accounting for these fixed percentages against growing revenue streams like custom projects and B2B contracts, you can defintely see how much cash stays in your pocket. Fees are the price of admission, but margins are where you win.

Getting from lease signing to profitability requires a clear view of your signage business startup costs, including $100,000 in leasehold improvements and specialized printing equipment. This analysis identifies the exact month you stop burning cash and start covering your $5,800 monthly rent and $1,400 utility bills through consistent sales volume. Knowing your number is the only way to sleep at night.

Use built-in benchmarks for evaluating profitability of sign shop franchise units to sanity-check your labor costs and COGS for vinyl and inks. If your Year 1 vinyl costs exceed the 12.5% benchmark, the model helps you identify whether the issue is waste, pricing, or supplier terms before it erodes your bottom line. Benchmarks keep your ego in check and your bank account full.


Simply purchase and download the financial model template, then access it instantly using Microsoft Excel or Google Sheets. No installation or technical expertise required-just open and start working.

Enter your business-specific numbers, including revenue projections, costs, and investment details. The pre-built formulas will automatically calculate financial insights, saving you time and effort.

Leverage the investor-ready format to confidently showcase your financial projections to banks, franchise representatives, or investors. Impress stakeholders with clear, data-driven insights and professional reports.

Leverage the investor-ready format to confidently present your projections to banks, franchise representatives, or investors.