
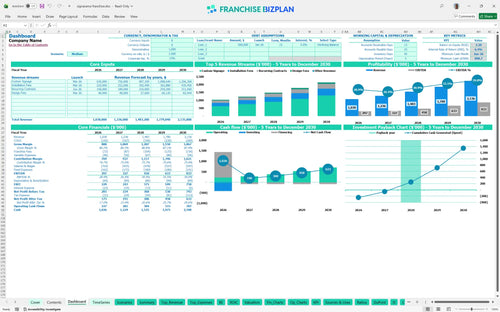
All-in-one Dashboard
Core inputs and core outputs


This comprehensive tool includes a franchise unit operating expense budget template, detailed CAPEX (capital expenditure) schedules, and multi-year cash flow projections designed for the signage industry.
Core inputs and core outputs
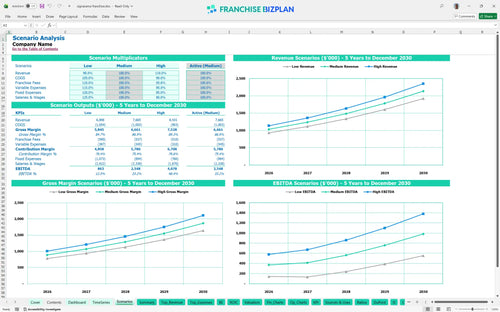
Three scenario analysis
Presentation ready
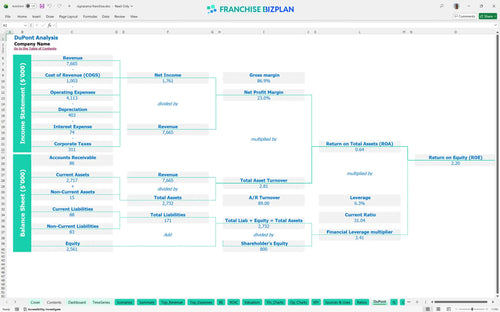
DuPont analysis
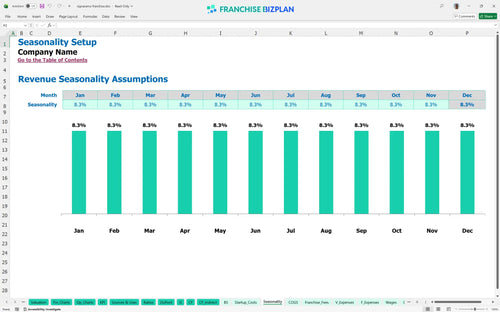
Researched revenue assumptions
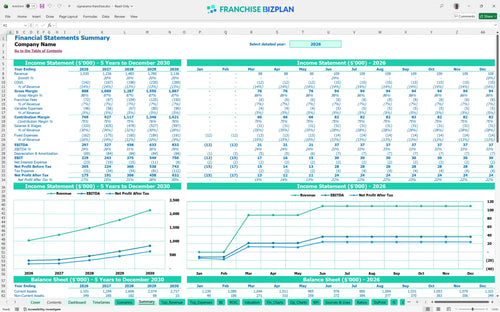
Lender-friendly financial outputs
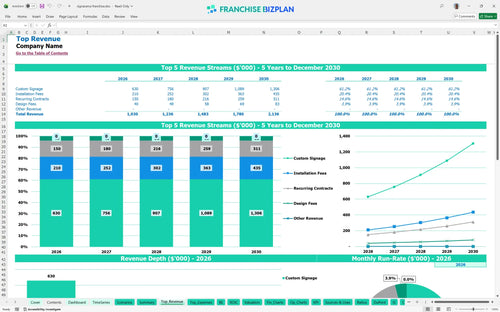
Revenue stream detailed view
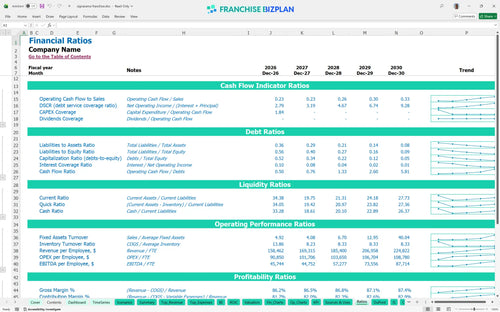
Performance metrics benchmark
We built this franchise unit financial model using deep research into the signage and visual communications sector. The assumptions for revenue streams like custom signage and installation fees, along with expenses like the $75,000 GM salary, are pre-populated and fully editable to reflect real-world Austin or similar market conditions. With a year one EBITDA of $297,000 and a three-year payback period, this model provides a data-driven look at the potential of this investment.
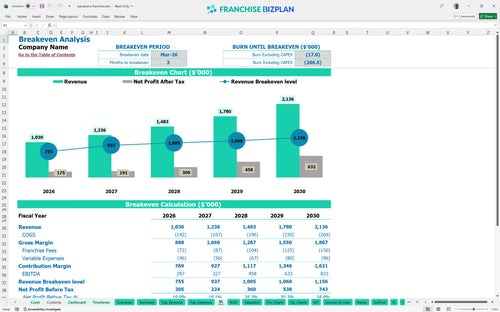
This unit is projected to reach its break-even date in March 2026, just three months after launching. By the end of the first full year, you are looking at $297,000 in EBITDA, with profits defintely scaling as recurring contracts grow. Here is the quick math: with a $1.03M year one revenue, your net margin stays healthy even after the 6% royalty and 1% marketing fees. Signage franchise unit profit margin analysis shows that reaching the $2.1M revenue mark by year five nearly triples your annual EBITDA.
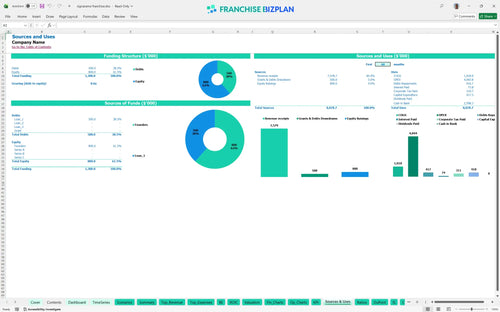
You will need approximately $417,500 in total capital expenditure planning to get this unit operational. This includes the $49,500 franchise fee, $140,000 for leasehold improvements, and $90,000 for wide-format printers and vinyl cutters. The model also accounts for $55,000 for installation vehicles and $45,000 for a CNC router. Still, you should keep an eye on your minimum cash point of $899,000 in June 2026 to ensure you have enough working capital during the ramp-up phase.
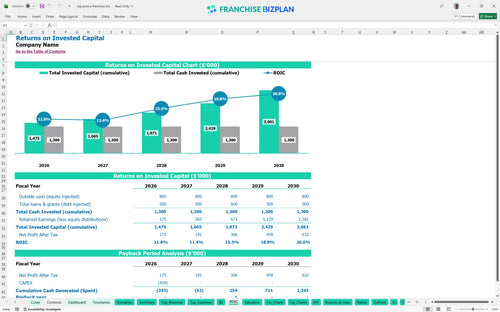
The model shows an Internal Rate of Return (IRR) of 6.39% and a Return on Equity (ROE) of 2.2 over the five-year period. Your years to payback is estimated at 3 years, which is standard for a retail-service hybrid with high equipment costs. This franchise investment prospectus helps you see that while the upfront cost is significant, the cash flow matures quickly. What this estimate hides is the potential for higher returns if you manage to scale your installation specialist team faster than the FTE (full-time equivalent) forecast suggests.
Your monthly break-even depends on covering roughly $14,150 in fixed costs, including the $9,000 rent and $1,100 property insurance. Using this Excel spreadsheet for franchise financial projections, we see that volume is the biggest driver; you need to hit your sales targets by month three to stop the burn. If labor for your production technicians or installation specialists runs over budget, that break-even point will push back. Efficiency in the shop is the secret to keeping your head above water early on.
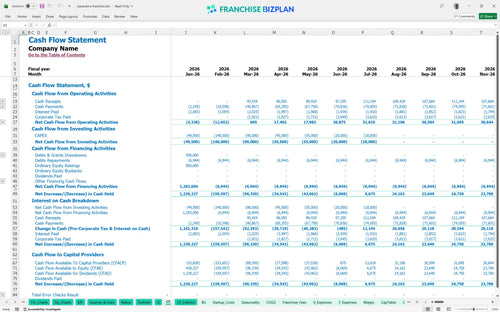
The lowest cash point occurs in June 2026 at $899,000, which suggests you need a solid initial capital stack to handle the equipment purchases and staffing. This franchise unit cash flow projection model shows that your cash position improves rapidly after the first six months. But, if your custom signage revenue lags by even 10%, you will need that cash buffer to cover the $42,000 annual salaries for your installers. Cash is king when you are waiting 30 days for corporate clients to pay their invoices.
Evaluating franchise investment opportunities with excel allows you to see how a 10% drop in revenue affects your year one $297,000 EBITDA. In a high-growth scenario, hitting $1.5M in revenue by year three significantly improves your IRR and shortens the payback period. The model shows that your fixed costs like the $700 general liability insurance stay flat, so every extra dollar in sales mostly drops to the bottom line. Small changes in your 11% sign material costs can also swing your margin by thousands of dollars annually.
This franchise financial model template is built in Excel to give you total control over your numbers. You can swap out the pre-filled assumptions for your specific territory, adjust the 6% royalty rate, or change the $9,000 monthly rent to match your local lease. It is a flexible tool that handles the heavy lifting of math so you can focus on strategy. One wrong formula in a DIY sheet can ruin your budget, but this setup keeps everything linked and accurate.

Success in the signage industry is about the long game, and this small business financial forecasting template maps out your first 60 months. We have modeled revenue growing from $1.03 million in year one to over $2.1 million by year five based on scaling your design and installation teams. It includes a full profit and loss statement template to track how EBITDA (earnings before interest, taxes, depreciation, and amortization) scales as you add more recurring contracts. Honestly, seeing the five-year horizon helps you decide when to buy that second installation vehicle.

Operating within a brand system means managing specific costs like the $49,500 initial fee and ongoing 1% marketing fund contributions. This franchise unit profitability analysis factors these in automatically so you see your true store-level margin after the franchisor takes their cut. We also account for the 6% royalty on gross sales, which is a major line item as you scale toward $2 million in revenue. Tracking these fees ensures your local pricing covers both your overhead and your brand obligations.

Getting the doors open requires a clear franchise startup cost calculator that covers everything from $140,000 in leasehold improvements to $90,000 for wide-format printers. This model performs a break-even point calculation to show exactly when your monthly sales cover the $9,000 rent and $1,700 utility bills. Knowing your 'nut' is essential for surviving the first few months of operation. If your build-out costs creep higher, the model shows you how many extra custom signs you need to sell to stay on track.

We used a sign shop business plan template approach to include realistic benchmarks for labor and materials. For example, sign materials are modeled starting at 11% of sales, which is a key metric for any manufacturing-heavy franchise. These benchmarks help you sanity-check your performance against other units in the network. If your freight shipping costs exceed the 2.8% benchmark, you know exactly where to look for waste. It is like having a seasoned operator looking over your shoulder.


Simply purchase and download the financial model template, then access it instantly using Microsoft Excel or Google Sheets. No installation or technical expertise required-just open and start working.

Enter your business-specific numbers, including revenue projections, costs, and investment details. The pre-built formulas will automatically calculate financial insights, saving you time and effort.

Leverage the investor-ready format to confidently showcase your financial projections to banks, franchise representatives, or investors. Impress stakeholders with clear, data-driven insights and professional reports.

Leverage the investor-ready format to confidently present your projections to banks, franchise representatives, or investors.