
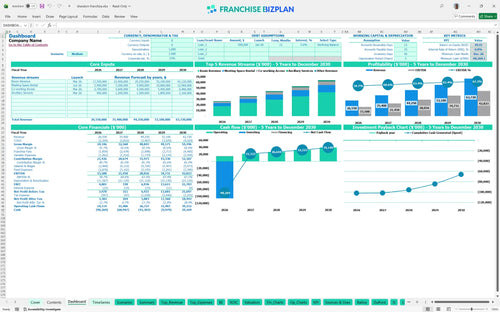
All-in-one Dashboard
Core inputs and core outputs


This comprehensive financial model provides a turnkey solution for projecting revenue, managing expenses, and evaluating the long-term ROI of a full-service hospitality unit.
Core inputs and core outputs
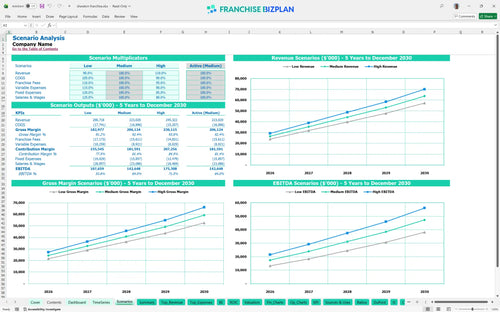
Three scenario analysis
Presentation ready
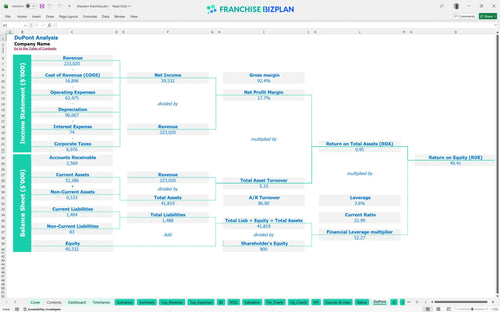
DuPont analysis
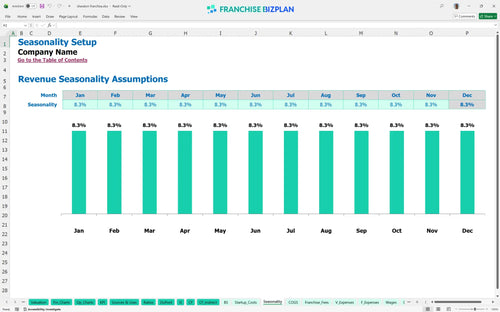
Researched revenue assumptions
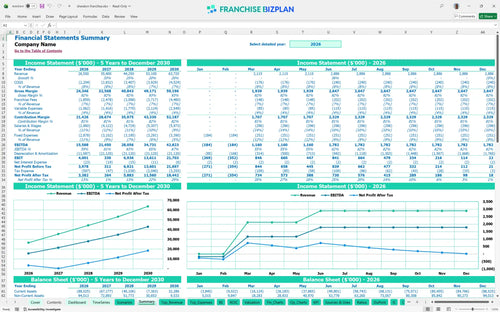
Lender-friendly financial outputs
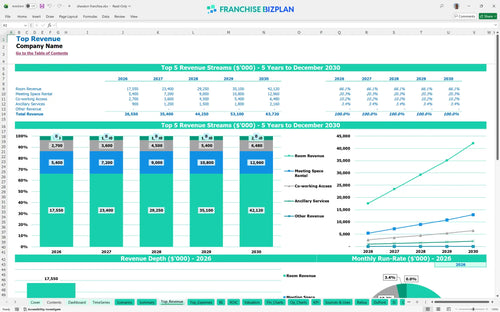
Revenue stream detailed view
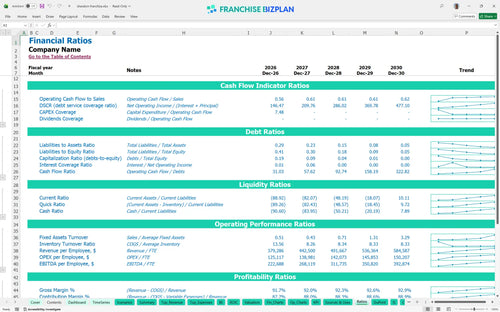
Performance metrics benchmark
We built this franchise unit financial model using our own research into full-service hospitality benchmarks and brand standards. Key assumptions, including room revenue starting at $11.7M and a $100,000 initial franchise fee, are pre-populated and fully editable to match your specific site. The model captures the reality of a $26.55M year-one revenue target and the complex staffing requirements of a premium property.
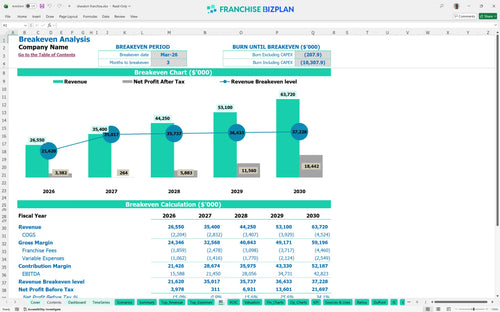
Your franchise profitability analysis shows a rapid move toward operational stability, with the unit reaching breakeven in just 3 months. By March 2026, the model projects that revenue from rooms, meetings, and co-working will cover the $15,588,000 in year-one EBITDA requirements after accounting for royalties and fixed costs.
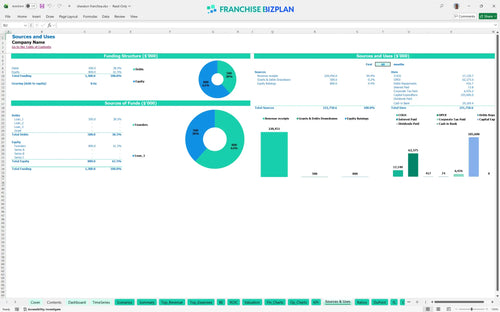
You will need a significant hospitality capital expenditure budget to launch this unit, with total startup costs exceeding $105 million. This startup budget spreadsheet for hospitality ventures details how to calculate startup costs for a hotel franchise, including the $60M leasehold improvement and $15M guest room FF&E.
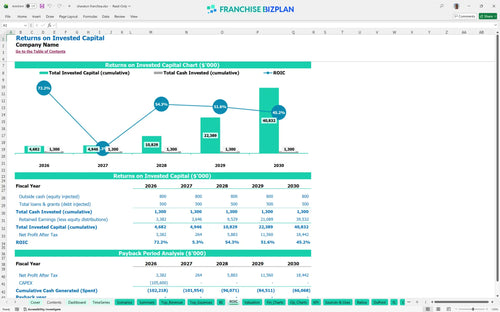
The franchise investment ROI analysis template indicates a long-term play, as the payback period extends after year 5 despite strong annual cash flows. With an IRR of 0.83% and a Return on Equity of 49.41, you are defintely looking at a wealth-preservation and steady-income asset rather than a quick flip.
This hotel franchise unit economic model Excel identifies the break-even point at month 3 of operations. Reaching this milestone depends heavily on room revenue volume and managing the $251,000 in monthly fixed costs, including rent, utilities, and insurance.
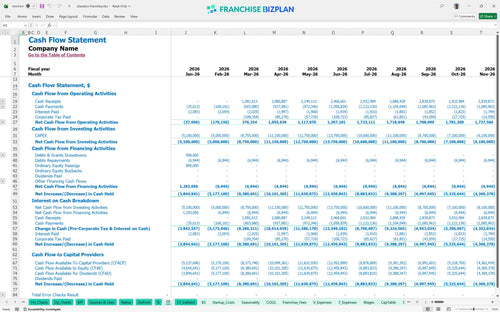
When estimating operating expenses for full-service hotels, you must account for the deep cash trough during the construction and ramp-up phases. The lowest cash point hits -$90,269,000 in December 2026, meaning you need robust financing to survive the heavy CAPEX cycle before mature cash flows kick in.
Evaluating profitability of hotel co-working spaces and meeting rentals across scenarios shows that a 10% drop in revenue can push the lowest cash point even deeper. High-performance scenarios, where revenue hits $63.7M by year 5, significantly improve the year-1 EBITDA margin and shorten the path to long-term equity growth.
This hotel franchise financial model is fully customizable in Excel, allowing you to adjust every variable from room rates to occupancy levels. It includes pre-filled formulas and editable assumptions for financial planning for hotel event space revenue and co-working monetization, ensuring you can adapt the numbers to your specific urban or suburban territory.

Use this hotel business plan template to map out your long-term growth with detailed 5-year revenue, cost, and cash flow projections. It provides a clear financial projection template for boutique hotels or large-scale full-service units, showing how EBITDA scales from $15.5M in year one to over $42.8M by year five.

This tool simplifies the franchise disclosure document financial analysis by automating the calculation of ongoing obligations. It handles the 6% royalty fee structure and the 1% marketing fund contribution, ensuring you see the impact of analyzing hotel franchise royalty and marketing fees on your bottom line before you sign the agreement.

Planning hospitality franchise startup costs requires precision to avoid mid-ramp liquidity traps. This franchise investment calculator helps you estimate the total initial investment and identifies the exact sales volume needed to cover fixed costs like the $125,000 monthly rent and $32,000 property tax.

We integrated best practices for hotel franchise financial forecasting by including benchmarks for RevPAR (Revenue per Available Room) calculation and hotel operational expense projections. These metrics allow you to sanity-check your labor costs-like the 45 housekeeping staff needed at launch-against industry standards to ensure your store-level margin stays healthy.


Simply purchase and download the financial model template, then access it instantly using Microsoft Excel or Google Sheets. No installation or technical expertise required-just open and start working.

Enter your business-specific numbers, including revenue projections, costs, and investment details. The pre-built formulas will automatically calculate financial insights, saving you time and effort.

Leverage the investor-ready format to confidently showcase your financial projections to banks, franchise representatives, or investors. Impress stakeholders with clear, data-driven insights and professional reports.

Leverage the investor-ready format to confidently present your projections to banks, franchise representatives, or investors.