
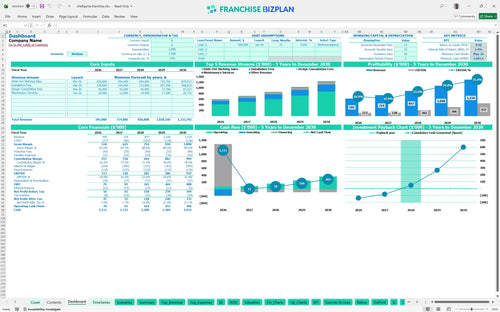
All-in-one Dashboard
Core inputs and core outputs


This product is a comprehensive Excel template for franchise unit financial forecasting that includes P&L statements, cash flow tracking, and detailed CapEx schedules tailored for home service operations.
Core inputs and core outputs
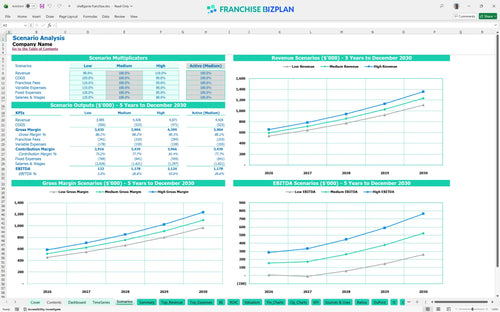
Three scenario analysis
Presentation ready
DuPont analysis
Researched revenue assumptions
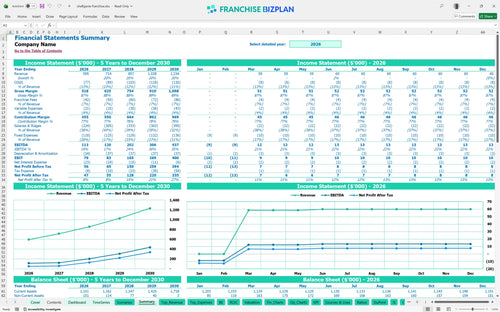
Lender-friendly financial outputs
Revenue stream detailed view
Performance metrics benchmark
We built this home service franchise business plan model using detailed research into the home organization sector to ensure your projections are grounded in reality. The model comes pre-populated with key data, including a Year 1 revenue target of $595,000 and an initial EBITDA of $113,000, which are fully editable to match your specific Scottsdale or local market conditions.
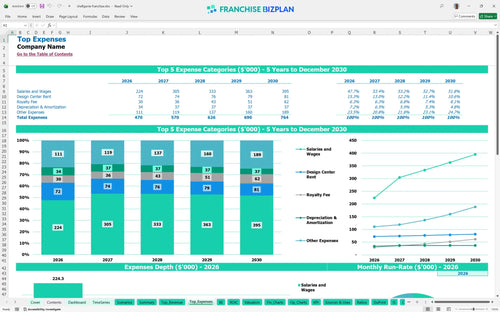
This unit is designed to hit profitability quickly, with a breakeven date set for April 2026, just four months after launch. By Year 3, you are looking at an EBITDA of $202,000 after accounting for all royalties, marketing fees, and the $70,000 GM salary. This is how to evaluate the profitability of a home organization franchise without the guesswork. Here is the quick math: your margin expands as shelving hardware costs drop from 11% to 9% over five years.
To launch this unit in the US, you need approximately $184,500 in initial capital, which covers everything from the franchise fee to your first installation vehicle. This business investment analysis shows that your largest upfront costs are the $69,500 fee and the $30,000 design center build-out. Knowing how to estimate startup costs for a home improvement franchise prevents mid-project cash crunches.
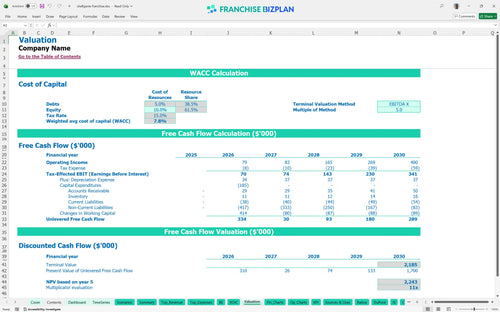
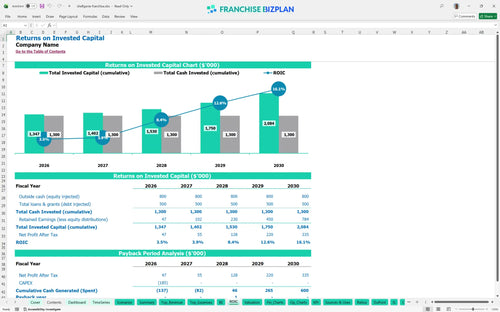
Your return on investment calculation shows a 3-year payback period and an internal rate of return (IRR) of 5.39%. While the IRR is conservative, the return on equity (ROE) of 0.98 indicates a solid foundation for a single-unit operator. Most investors focus on the fact that EBITDA grows to $437,000 by Year 5, which significantly increases the exit value of the business.
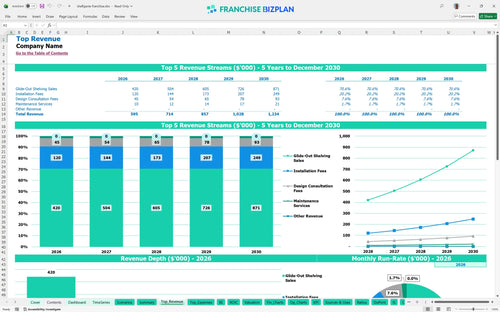
Calculating break-even point for a new franchise location shows you need to clear your fixed costs by April 2026. Your unit economics are primarily driven by Glide-Out shelving sales, which start at $280,000 in the first year. If your installation fees or design consultation volume lags, your breakeven will slide, so keeping the sales funnel full is the priority.
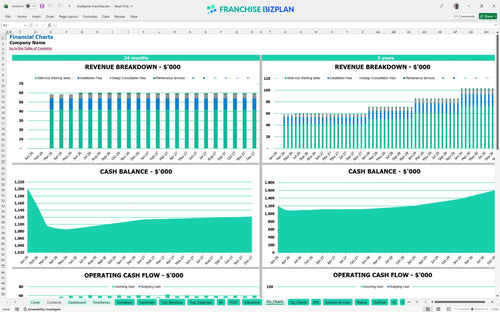
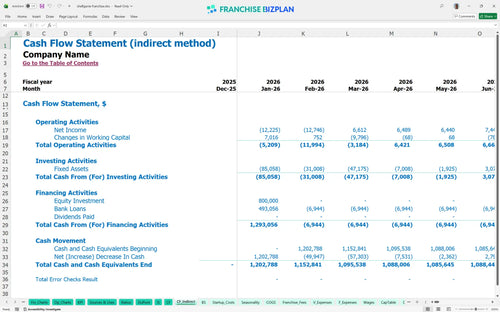
The model identifies May 2026 as your lowest cash point, with a minimum cash balance of $1,086,000 if you start with a significant buffer. Budgeting for franchise marketing and labor expenses early is critical, especially with a $1,500 monthly hyper-local marketing commitment. Still, you should maintain a cash reserve to handle the ramp-up of your $55,000-a-year lead designer and installation team.
Financial modeling for service-based franchise expansion requires looking at High and Low cases to see how a 20% swing in revenue affects your 5.39% IRR. In a High scenario, Year 5 revenue could exceed $1.2M, significantly shortening your 3-year payback period. Financial planning for luxury home service franchises means you must be ready for shifts in affluent consumer spending that impact your $30,000 consultation fee stream.
Finance: update unit break-even and payback model by Friday
This franchise financial model template provides a fully adjustable Excel environment where you can tweak every assumption to fit your specific territory. It uses pre-filled formulas so you can change pricing or labor rates and see the impact on your bottom line instantly. It is defintely the fastest way to move from a generic idea to a territory-specific plan without building from scratch.

Planning for the long term is vital when forecasting revenue for custom cabinet shelving business units. This model scales your projections from a Year 1 revenue of $595,000 up to $1,234,000 by Year 5, giving you a clear view of how your margins evolve as you mature. This franchise financial projection excel tool helps you visualize the transition from a startup phase to a high-volume operation.

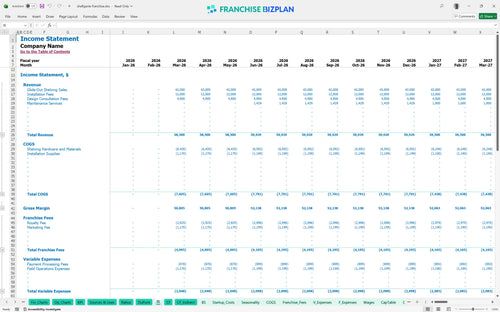
Understanding franchise disclosure document financial data is easier when you can see the actual cash impact of a 5% royalty and 2% marketing fee. This model tracks these obligations against your monthly sales, so you know exactly what is left for your local overhead. It simplifies the franchise royalty fee structure so you can focus on store-level performance rather than complex math.

This franchise startup cost calculator breaks down your initial $184,500 capital requirement into clear categories like the $69,500 franchise fee and $30,000 build-out. You can estimate the total investment needed to get the doors open and the lights on in your design center. It maps out your monthly cost structure to show exactly how much capital you need to reach a stable operating state.

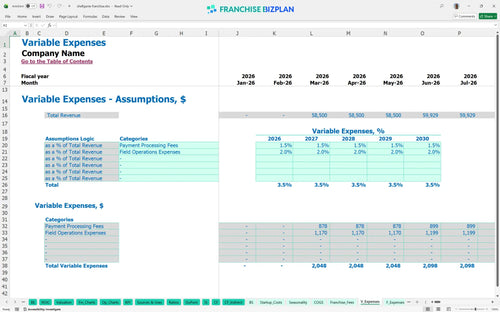
We have included standard operating expenses for a retail design franchise to help you sanity-check your local costs against industry norms. From a $6,000 monthly rent to utilities and insurance, these benchmarks act as a guardrail for your franchise operational costs. Use these figures to identify where your unit might be overspending on labor or supplies compared to the typical model.


Simply purchase and download the financial model template, then access it instantly using Microsoft Excel or Google Sheets. No installation or technical expertise required-just open and start working.

Enter your business-specific numbers, including revenue projections, costs, and investment details. The pre-built formulas will automatically calculate financial insights, saving you time and effort.

Leverage the investor-ready format to confidently showcase your financial projections to banks, franchise representatives, or investors. Impress stakeholders with clear, data-driven insights and professional reports.

Leverage the investor-ready format to confidently present your projections to banks, franchise representatives, or investors.