
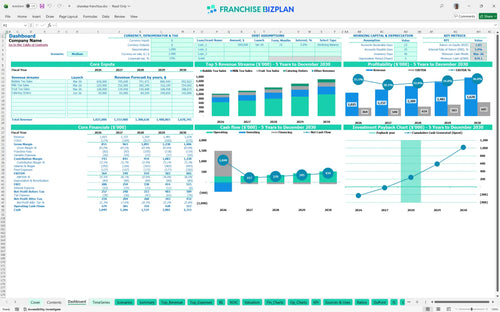
All-in-one Dashboard
Core inputs and core outputs


This quick service restaurant financial model provides a complete toolkit for forecasting revenue, tracking startup expenses, and analyzing unit-level profitability for a new beverage retail location.
Core inputs and core outputs
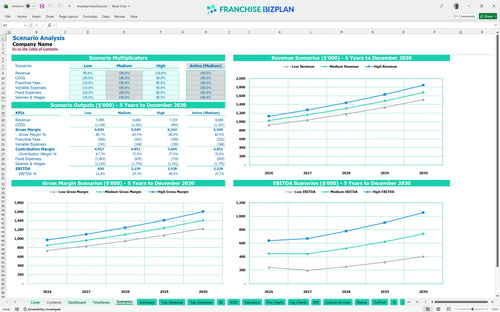
Three scenario analysis
Presentation ready
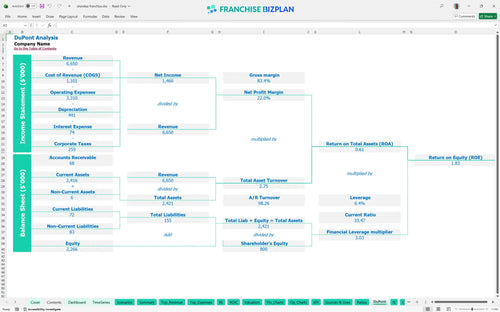
DuPont analysis
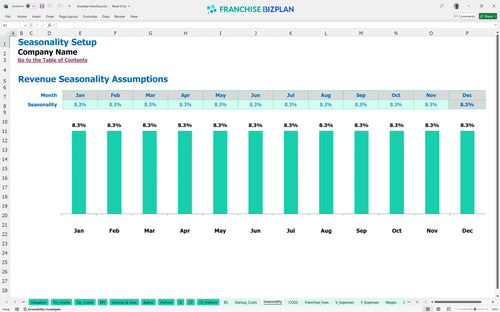
Researched revenue assumptions
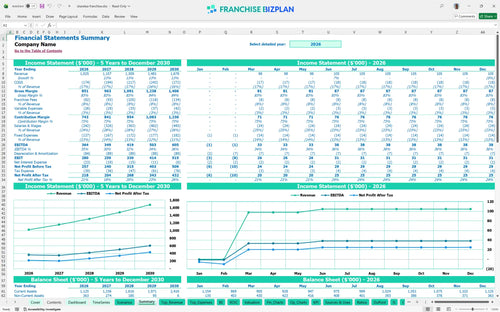
Lender-friendly financial outputs
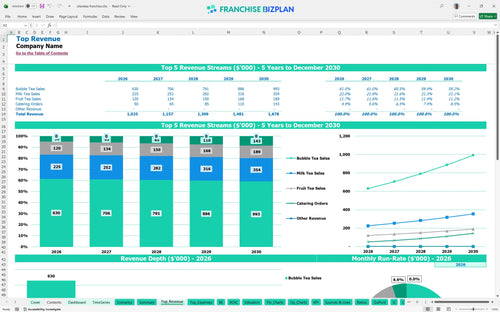
Revenue stream detailed view
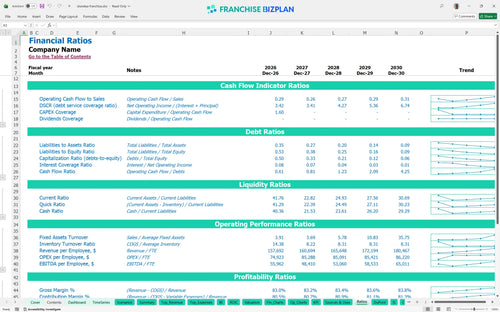
Performance metrics benchmark
We built this financial model for new franchise owners using our own research on the bubble tea sector. Key assumptions, including the $12,000 franchise fee, 6% royalty, and $1,025,000 Year 1 revenue, are pre-populated and fully editable to match your specific location. This tool ensures you have a data-driven view of your potential unit economics from day one.
The model shows the unit becomes profitable in 2026, its first year of operation, with an initial EBITDA of $364,000. This bubble tea shop profit margin analysis accounts for a 14% COGS for tea and boba, plus the 8% total fee load for royalties and marketing. Every percentage point in tea waste directly hits your pocket.
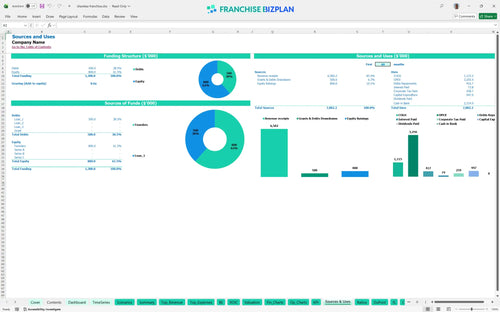
To launch this unit, you need to know how to calculate startup costs for a boba tea franchise, which total approximately $447,000 in this model. This includes $250,000 for leasehold improvements, $75,000 for brewing equipment, and the $12,000 franchise fee. Build-out is your biggest check, so watch those contractors.
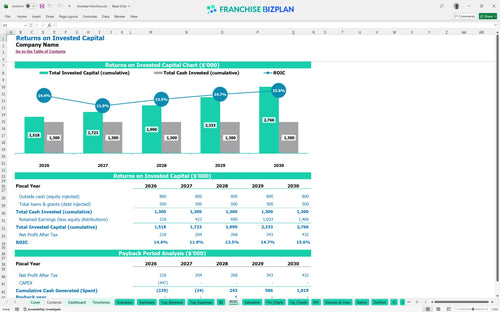
This franchise investment return calculator in Excel estimates an Internal Rate of Return (IRR) of 5.95% and a Return on Equity (ROE) of 1.83. With a 3-year payback period, the franchise unit economics show a steady path to recovering your initial capital. Three years to get your money back is a solid benchmark.
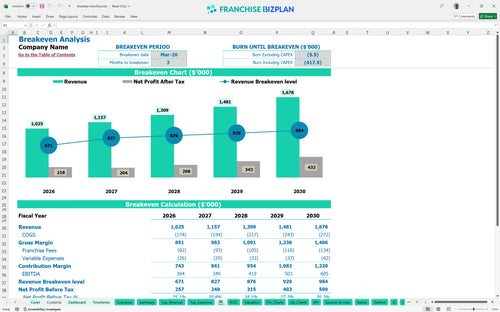
The unit hits its monthly break-even point in March 2026, just 3 months after opening. Commercial real estate lease modeling shows that the $10,500 monthly rent is the primary fixed cost driver, requiring high daily volume to stay in the black. Volume is the only way to outrun a high-rent lease.
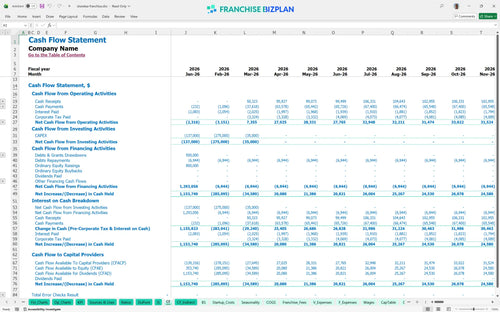
The lowest cash point is $834,000 in March 2026, which marks the end of the initial ramp-up phase. You'll defintely want to maintain a working capital buffer to handle the timing gaps between opening expenses and consistent daily sales. Cash is king, especially in the first ninety days.
High scenarios show revenue climbing to $1,678,000 by Year 5, while low scenarios help in estimating labor costs for bubble tea retail stores if wages rise faster than expected. These franchise profitability projections allow you to see how peak cash needs shift under different market conditions. Planning for the worst helps you achieve the best.
Finance: update unit break-even and payback model by Friday
This franchise financial model template is built entirely in Excel, allowing you to adjust every driver from cup prices to local tax rates. It features an Excel template for franchise financial forecasting with pre-filled formulas and editable assumptions, making it simple to test different business cases for your specific territory or store layout.

Success in the beverage space requires looking beyond the first year of operations. This tool provides detailed financial projections for QSR franchise locations, covering five years of revenue, costs, and cash flow to help you build a viable bubble tea franchise business plan that accounts for long-term growth and inflation.

Operating a branded unit means managing specific overhead like the 6% royalty and 2% marketing fund contributions. Our model simplifies franchise royalty fee calculation and analyzing franchise royalty and marketing fees, ensuring you see the true net income after all brand-related obligations are paid to the franchisor.

Knowing your 'all-in' number is critical before signing a lease or a franchise agreement. This startup budget template for retail food franchises includes a franchise startup cost spreadsheet that tracks everything from the $12,000 initial fee to leasehold improvements, helping you pinpoint the exact sales volume needed to reach profitability.

We have integrated food industry operating expenses and an operating expense tracker for beverage franchises to help you sanity-check your numbers. By comparing your projected labor and occupancy costs against industry standards, you can identify margin leaks before they become permanent problems in your store-level P&L.


Simply purchase and download the financial model template, then access it instantly using Microsoft Excel or Google Sheets. No installation or technical expertise required-just open and start working.

Enter your business-specific numbers, including revenue projections, costs, and investment details. The pre-built formulas will automatically calculate financial insights, saving you time and effort.

Leverage the investor-ready format to confidently showcase your financial projections to banks, franchise representatives, or investors. Impress stakeholders with clear, data-driven insights and professional reports.

Leverage the investor-ready format to confidently present your projections to banks, franchise representatives, or investors.